
User`s guide


Reporter
Response Profile Graphs
5967–9446 109
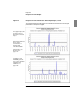
Figure 18 Response Profile: Parameters and Sample Graph, cont’d
This sample Response Profile graph was created with the Duration and Targets
parameters on the previous pages.
Dark horizontal line at
25 ms shows
Conformance of
Average with
Threshold statistic
Line graph represents
average response
time for the selected
target
Compliance and
Availability percent-
ages can be included
using Reporter
variables; see
page 149
Target names are
discussed on
page 112