
User`s guide


Reporter
Response Profile Graphs
108 5967–9446
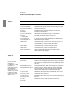
Figure 18 Response Profile: Parameters and Sample Graph, cont’d
Response Profile
Target parameters
Baseline target and statistic; choices
depend on selected statistics
Indicate whether to
graph a baseline and
statistic to use, and
the confidence level
Baseline is available
only for Each target in
separate graph and
when page scope is
Segment View (see
page 147)
Right box shows
targets that are
available but are not
selected for this
graph
Target names are
discussed on
page 112
Left box shows
targets selected for
this graph
Highlight targets in
one box and click the
arrow to move them
to the other box
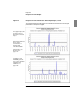
This example graphs average response times and conformance with a response
threshold of 25 milliseconds for two specific targets, filesrv1 and filesrv2.
Indicate whether to
graph all targets in
the same graph or
generate a separate
graph for each target;
see page 112
Indicate whether to
graph all targets, all
targets common to
the configured data
sources, or specific,
selected targets
Indicate the statistics
to include in the graph;
for descriptions, see
page 110