
User`s guide


Reporter
Response Profile Graphs
106 5967–9446
To configure a Response Profile graph
1 Add or modify a Response Profile graph, as described on
page 72 and page 73, respectively.
2 Configure the Duration, Targets, Exception, and Graph
parameters as needed.
Response Profile graphs include the following configuration parameters:
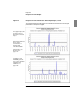
● Duration parameters set the dates and times to be included in the
graph. Figure 18 on page 107 shows the Duration parameters for a
Response Profile graph, along with corresponding sample graph output.
● Targets parameters indicate which targets and which response and
availability statistics to include in the graph and whether to calculate a
baseline envelope. For details on target names, see page 112. For a
description of the available statistics, see page 110. For information on
baseline calculations, see page 47.
Figure 18 on page 107 shows the Targets parameters for a Response
Profile graph, along with sample graph output.
● Exception parameters indicate whether the graph is generated only
when exceptional criteria are met. For details, see “Exception Report-
ing” on page 139.
● Graph parameters determine the graph’s appearance. For information
on Graph parameters, refer to page 146.
See Also “Response Profile Statistics” on page 110.
“Target Names” on page 112.
“Baselines” on page 47.
“Exception Reporting” on page 139.
“Tailoring a Report’s Appearance” on page 146.
Important
Response Profile graphs are available only for HP-UX and only if
response data collection is configured.