
Technical data

9 Verifying CAN Serial Bus Communication
50 Agilent InfiniiVision 7000B Series Oscilloscopes Evaluation Guide
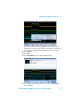
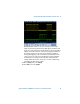
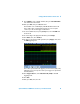
The oscilloscope should now be triggering on frame 07F. Because “F” is
unique in the lower nibble of the ID for our demo board signal, specifying
the upper two nibbles (07) is not necessary in order to trigger on 07F hex.
Let’s now make some time-correlated measurements across analog,
digital, and serial bus signals.
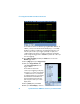
18 To measure the average voltage of the channel 2 waveform (1 Hz signal),
first press [Meas], and then change the Source to “2”.
19 Next, press Select:; then, select Average.
20 To begin executing the selected measurement, either push the selection
knob or press Measure Avg.
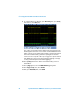
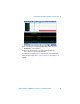
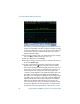
21 In order to view both the measurements and the value of the parallel
digital bus (B1), press the back/up key (above the power switch).
The channel 2 signal (green waveform) might represent the output of an
analog sensor in an automobile or an industrial system. Perhaps it is an
electrical representation of temperature. This analog signal is then
converted to an 8-bit digital byte using an ADC. The digital output of the
8-bit ADC is represented by the eight digital waveforms (D0-D7) and
Bus1, which is an overlay display of all eight bits. This 8-bit digital output
of the ADC is then converted to a serial string of data embedded within
CAN frame ID: 07F. This serial data byte is displayed as the 2-digit hex
white characters within the CAN serial decode trace shown at the
bottom of the display. We can now see all three (analog waveform with
measurement, digital bus, and serial data) all time-correlated. However,
the update rate of the input signals and the oscilloscope are too fast to
Back