
User`s guide


224 5000 Series Oscilloscope User’s Guide
5 Displaying Data
You can use the Zoom horizontal sweep mode for easier
navigation of the acquired data.
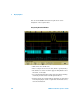
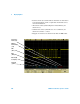
Interpreting Decoded SPI Data
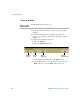
• White lines show an idle bus.
• Blue rectangles show an active bus (inside a packet/frame).
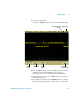
• The number of clocks in a frame appears in light-blue above
the frame, to the right.
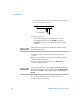
• Decoded hexadecimal data values appear in white and may
extend beyond the frame if an idle period follows.
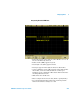
• Red dots in the decode line indicate that there is data that is
not being displayed. Scroll or expand the horizontal scale to
view the information.