
Specifications

30 | Keysight | InniiVision 3000T X-Series Oscilloscopes - Data Sheet
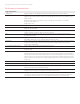
Waveform measurements
Cursors
2
Single cursor accuracy:
±[DC vertical gain accuracy + DC vertical offset accuracy + 0.25% full scale]
Dual cursor accuracy:
±[DC vertical gain accuracy + 0.5% full scale]
1
Units: Seconds(s), Hz (1/s), Phase (degrees), Ratio (%)
Automatic measurements Measurements continuously updated with statistics. Cursors track last selected measurement. Select up to eight
measurements from the list below:
Snapshot All: measure all single waveform measurements (31)
Voltage: peak-to-peak, maximum, minimum, amplitude, top, base, overshoot, pre-shoot, average- N cycles, average- full
screen, DC RMS- N cycles, DC RMS- full screen, AC RMS- N cycles, AC RMS- full screen (std deviation), ratio- N cycle,
ratio- full screen
Time: period, frequency, counter, + width, - width, burst width, +duty cycle, -duty cycle, bit rate, rise time, fall time, delay,
phase, X at min Y, X at max Y
Count: positive pulse count, negative pulse count, rising edge count, falling edge count
Mixed: area- N cycles, area- full screen
Counter
(see pg 32 for 8-digit
precision counter)
Built-in frequency counter:
Source: on any analog or digital channel
Resolution: 5 digits
Maximum frequency: bandwidth of scope
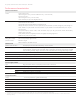
Performance characteristics
1. Denotes warranted specications, all others are typical.
Specications are valid after a 30-minute warm-up period and ±10 °C from rmware calibration temperature.
2. 1 mV/div and 2 mV/div is a magnication of 4 mV/div setting. For vertical accuracy calculations, use full scale of 32 mV for 1 mV/div and 2 mV/div
sensitivity setting.
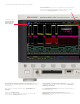
Display characteristics
Display 8.5-inch capacitive touch / gesture enabled display
Resolution 800 (H) x 480 (V) pixel format (screen area)
Graticules 8 vertical divisions by 10 horizontal divisions with intensity controls.
Format YT, XY, and Roll
Maximum waveform update rate > 1,000,000 wfms/s
Persistence Off, innite, variable persistence (100 ms - 60 s)
Intensity gradation 64 intensity levels
Waveform math
Number of math functions Two, displays FFT and one math simultaneously. Can be cascaded.
Arithmetic Add, subtract, multiply, divide, differentiate, integrate, FFT, Ax + B, squared, square root, absolute value,
common logarithm, natural logarithm, exponential, base 10 exponential, low pass lter, high pass lter, averaged
value, smoothing, envelope, magnify, max hold, min hold, measurement trend, chart logic bus (Timing or State)
Enhanced FFT Record size Up to 64 kpts resolution
Window types Hanning, Flat Top, Rectangular, Blackman-Harris
Time gated FFT Gate the time range of data for FFT analysis in the zoom view. For time and frequency domain correlated analysis.
Waveforms FFT, max hold, min hold, average
Peak search Max 11 peaks, threshold and excursion control.
Search, navigate, and lister
Type Edge, pulse width, rise/fall, runt, frequency peak, serial bus 1, serial bus 2
Copy Copy to trigger, copy from trigger
Frequency peak Source Math functions
Max # of peaks 11
Control Results order in frequency or amplitude
Result display Event lister or navigation. Manual or auto scroll via navigation or touch event lister entry to jump to a specic event.