User’s Guide Agilent Technologies 14761A Harmonic and Flicker Emissions Tests for EN 61000-3-2, EN 61000-3-3, and EN 60555 Part 2 Agilent Part No.
Notice This document contains proprietary information protected by copyright. All rights are reserved. No part of this document may be photocopied, reproduced, or translated into another language without the prior consent of Agilent Technologies. The information contained in this document is subject to change without notice. Copyright 1995 -1998, 2000 Agilent Technologies, Inc. Windows is a registered trademark of Microsoft Corporation.
Table of Contents Notice Warranty Limitation of Warranty Revisions Printing History Table of Contents 1 INTRODUCTION How to Use this Manual The Agilent 6800-Series AC Power Source/Analyzer The Agilent 14761A Harmonic/Flicker Test System Software EN 61000-3-2 and EN 60555 Part 2 Regulations Compliance Testing Implementation EN 61000-3-3 Regulation Compliance Testing Implementation 2 INSTALLATION Install the Software Connect the Equipment Installing Interface Card Drivers for Windows 3.1 or 3.
5 VIEWING TEST DATA Navigator Toolbar Viewing Quasi-stationary and Fluctuating Harmonics Graph Display Table Display Time-Series Display Statistics Display Probability Display (for Quasi-stationary or Fluctuating harmonics) Viewing 2.
C IEC MODE COMMAND SUMMARY Introduction Using the SENSe:CURRent:ACDC:RANGe command CALCulate:INTegral:TIME CALCulate:SMOothing CALCulate:LIMit:UPPer FORMat FORMat:BORDer MEASure:ARRay:CURRent:HARMonic? MEASure:ARRay:VOLTage:FLUCtuations:ALL? MEASure:ARRay:VOLTage:FLUCtuations:FLICker? MEASure:ARRay:VOLTage:FLUCtuations:PST? SENSe:CURRent:PREFerence SENSe:WINDow SYSTem:CONFigure D CLASS DETERMINATION Class A Device Selected Class B Device Selected Class C Device Selected Class D Device Selected EN 60555 Par
1 Introduction How to Use this Manual This manual describes the operation of the Agilent 14761A Harmonic/Flicker Test System (HFTS) software when used in conjunction with the Agilent 6800-Series AC Power Source/Analyzers. Its primary function is as a reference manual. If you have a question about a specific screen or how to perform a certain task, simply turn to the appropriate section of the manual.
1 - Introduction The Agilent 6800-Series AC Power Source/Analyzers The Agilent 6800-Series AC Power Source/Analyzers are specifically designed for testing products compliant to the IEC low-frequency emissions regulations for quasi-stationary current harmonics, fluctuating current harmonics, and voltage fluctuations and flicker.
Introduction - 1 EN 61000-3-2 and EN 60555 Part 2 Regulations EN 61000-3-2 and EN 60555 Part 2 regulate the magnitude of harmonic currents drawn by products from the ac line. For example, harmonic currents can occur as a result of high peak currents drawn by switch-mode power supplies.
1 - Introduction EN 61000-3-3 Regulation EN 61000-3-3 regulates the magnitude, rate, and time-duration of voltage fluctuations and flicker caused by products connected to the ac line. Voltage fluctuations are created by time-varying current drains working against branch circuit impedance that exists in all power distribution networks. Flicker occurs when an incandescent lamp changes in intensity due to the frequency and amplitude of voltage fluctuations in the same branch circuit.
2 Installation Install the Software NOTE: A README.TXT file is included on the installation disks. It contains product updates or corrections that are not documented in this manual. Use any text editor to read this file. The Agilent 14761A HFTS software (p/n 5063-2363) comes on two disks. When installed, it requires 5 Mbytes of hard disk space, 8 Mbytes of RAM, and 512 Kbytes of conventional memory. It also requires the correct interface card drivers to be installed on your PC.
2 - Installation Installing Interface Card Drivers for Windows 3.1 or 3.11 Systems ñ If you are using an Agilent 82335 GPIB card, install the driver software from the I/O Libraries CD-ROM (E2094) that came with the card. Open the \win31\disk1 directory on the CD-ROM and run setup.exe. If you do not have this CD-ROM, you may purchase it through a local Agilent Sales and Support office.
Installation - 2 icon to run the software.) When the software is run, it automatically searches for an interface card and queries the Agilent 6800-Series AC Power Source/Analyzer for its model number. Verify that your configuration is correct as follows: 1. Select the New button in the Welcome Window 2. In the Options menu, select the Configure... command. This displays a Configuration dialog box on the screen.
2 - Installation Default Settings In the Options menu, select Defaults to view the default settings. The following settings are configurable: ñ The line voltage and frequency that will be applied to the equipment under test. ñ The quasi-stationary/fluctuating harmonics regulations version that you will be testing to. Select either EN 61000-3-2 or the older EN 60555 Part 2 regulation. Press OK to accept the defaults, or Cancel to cancel the changes and exit the dialog box.
Installation - 2 Edit Copy Table Copies highlighted information from the table to the Clipboard Copy Graph Copies the presently displayed graph to the Clipboard View Main Lets you select the type of test to run Test Setup > Lets you select the test set-up parameters Pre-test Lets you run the pre-test Test Lets you run the test Display > Lets you view specific test results Report > Lets you view the test report Options Local Lockout Lets you disable the front panel keys of the Agilent 6800-
2 - Installation Menu Tabs The menu tabs that are located at the bottom of the screen let you easily access the primary functions of the Agilent 14761A HFTS software. These functions are also available from the file menus. Altogether, there are five groups of menu tabs: The Main level group accesses the following functions: The > symbol in the tab label indicates a lower-level of tabs, which access a number of additional screens. Once at the lower level, the /\ tab returns you to the Main Level.
3 Setting Up the Test If you have not already done so, click on the Agilent HFTS icon to run the software. Now you can set up your test. If the Agilent HFTS icon does not appear on your computer, go back to chapter 2 and install the Agilent 14761A HFTS software. Select a Test Type When you first run the Agilent 14761A HFTS software, the Welcome window appears. Select a test type from the Welcome Window. 1.
3 - Setting Up the Test ñ Selecting New From Template opens a dialog box that lets you select a template file which contains previously-configured test setup information. This template information will be copied into your new data file. The template itself is not changed unless you make subsequent changes to your setup and save them into the template using “Save as Template.”. When you run the test, the test data will then be added to the information obtained from the template.
Setting Up the Test - 3 Create a Template Template files contain setup information for the test that you will be running. Using templates can save valuable time by eliminating the need to enter repetitive data each time you set up a test. Create a template by entering information into the Main and the Test Setup windows. Use the Tab key to move among the different fields. 1.
3 - Setting Up the Test Select the Test Setup Options for Quasi-stationary or Fluctuating Harmonics Standard Test Options Standard options specify the line voltage, line frequency, test time, and device class for compliance tests. They are selected in the Standard window. 20 ñ Select the line voltage that will be applied to the equipment under test. Selecting Variable lets you enter a value other than 120 Vac or 230 Vac.
Setting Up the Test - 3 Class D: Equipment having an input current with a "special wave shape" (e.g. equipment with off-line capacitor-rectifier ac input circuitry and switch-mode power supplies) and an active input power ≤ 600 W. The active power is defined as Watts. For the Class D mA/W limits to apply, the active power must also be greater than 75 W. Motor Driven Device: Check this box if the equipment you are testing is a motor-driven device.
3 - Setting Up the Test ñ Note Select the rms and peak current limit of the Agilent 6800-Series AC Power Source/Analyzer that you will be applying to the equipment under test. (The Agilent Model 6843A only has rms current limit control, therefore, the peak current limit control does not appear.) Generally, it is best to leave these parameters set to their maximum default values.
Setting Up the Test - 3 Test Termination Options Termination options let you select the conditions that will terminate the test. They are selected in the Termination window. Note The following conditions terminate any test automatically if the Agilent 6800-Series AC Power Source/Analyzer operating limits are exceeded: Rail fault condition, Overtemperature, Overvoltage, and SOA. Refer to the applicable ac source User’s Guide for an explanation of these conditions. ñ Select termination on errors.
3 - Setting Up the Test If termination On Watch Events is enabled, you can select the following Watch Items criteria: ñ All harmonics greater than the specified percent of threshold ñ Odd harmonics greater than the specified percent of threshold ñ Odd ≤ 19 harmonics greater than the specified percent of threshold ñ Even harmonics greater than the specified percent of threshold ñ Nth, a specific Harmonic Number that is greater than the specified percent of threshold Select the Test Options for Vol
Setting Up the Test - 3 ñ Select the number of integration periods to be acquired during the test. The Resulting Time field displays the test duration based on the number of integration periods as well as the Pst integration time that you have specified in the Advanced window. The Pst integration time is set to a default of 10 minutes with the Advanced options disabled.
3 - Setting Up the Test Test Termination Options Note The following conditions terminate any test automatically if the Agilent 6800-Series AC Power Source/Analyzer operating limits are exceeded: Rail fault condition, Overtemperature, Overvoltage, and SOA. Refer to the ac source User’s Guide for more information. ñ Select termination on errors. One error will terminate the test when this is selected: UNR - when the output becomes unregulated. ñ Select termination when the current limit is exceeded.
4 Running the Test Before actual test data can be acquired, the pre-test must be run. This is accomplished in the Pre-Test window. As its name implies, the Pre-Test window centralizes functions that, following test setup, need to be performed prior to running an actual test. This includes running preliminary tests to measure quantities that are subsequently used to set test limits for Class C and Class D devices. Once the pre-test data is available, the main test can be started.
4 - Running the Test 3. It is also possible to increase the duration of the pre-test. One purpose of running a longer pretest is to obtain more data over which the test results are averaged. Additional data more accurately characterizes the worst-case operation of the equipment under test (see “Pre-test Measurements” for more information). 4. Press the Run Pre-test button to run the pre-test.
Running the Test - 4 Pre-Test Power Statistics This screen provides additional information about the active input power of the device under test.
4 - Running the Test Pre-Test Source Harmonics This screen displays the pre-test voltage data for harmonics 1-40 on a worst-case basis. The Limit(%) column indicates the permissible limits for each harmonic expressed as percentages of the fundamental voltage. For 230 V/50 Hz power distribution systems, these are: - No limits for the 1st harmonic (the fundamental) - 0.9% of Vfundamental for 3rd harmonic - 0.4% of Vfundamental for 5th harmonic - 0.3% of Vfundamental for 7th harmonic - 0.
Running the Test - 4 To Run a Pre-test for Voltage Fluctuations Pre-Test Summary 1. Select the Pre-test menu tab on the bottom of the screen to access the Pre-test Summary window. You can also access the Pre-test window from the View/Pre-test menu. 2. If desired, change the time delay from when power is applied until the pre-test is run. The default pre-test time is 10 seconds. 3. It is also possible to increase the duration of the pre-test.
4 - Running the Test display. The tabular data displayed in this window provides a permanent record of the test conditions that existed at the time of the voltage fluctuations test. ñ The Measured Values area on the right side of the display provide a record of the test conditions at the time the voltage fluctuations pre-test was run. ñ The Output Impedance of the Harmonic/ Flicker Test System is automatically set to the requirements of IEC 1000-3-3 when testing for Voltage fluctuations.
Running the Test - 4 value of the waveform by a one-shot rms current value obtained from the waveform data record. The quality of this measurement is a function of the variability of the current waveform crest factor over the integration period used for the corresponding rms current measurement.
4 - Running the Test 3. Select Perform post processing automatically at end of test execution to process test data immediately after the completion of the test. Post processing is required to generate test reports and to generate data for the Statistics and Probability displays. Depending on the length of the test, the post processing of data may require considerable time. Alternatively, you can post process the test data at a later time by opening the test file and pressing the Run Post processing button.
Running the Test - 4 Manual On/Auto Off (see caution) The ON pushbutton is active, letting the operator manually turn the output of the Agilent 6800-Series AC Power Source/Analyzer on from the Test window. The pictured control indicates that the output is presently off. Manual On/Manual Off (see caution) Both OFF and ON pushbuttons are active, providing full manual control of the output of the Agilent 6800-Series AC Power Source/Analyzer from the Test window.
4 - Running the Test Validation Mode Validation Mode is a special mode used to validate the software, hardware, and test method used to test to the harmonic current emissions regulation. It is not intended to be a formal proof of performance. Validation Mode should only be used with the Quasi-Stationary Harmonics test type selected. It cannot be used with Voltage Fluctuations. Additionally, validation of Voltage Fluctuations can be accomplished without running Validation Mode.
5 Viewing Test Data During test runs, data is continuously acquired and displayed in the various Display windows. Use the menu tabs on the bottom of the screen or the View menu to access the various displays. Use the Navigator toolbar on the top of the screen to scroll through the test record or search for specific test data in the test record. Note Refer to chapter 7 for information on printing graphs, tables and reports. Chapter 7 also explains how to print reports to a file.
5 - Viewing Test Data Search Parameters This control is only active when the display is set to Fixed. It puts up a dialog box that lets you search for specific items in the test data that you are presently viewing. Clicking on the red button initiates a search backward in time from the present cursor location. Clicking on the red ® button initiates a search forward in time from the present cursor location. Reset Max This control only applies to the harmonic Graph and Table displays.
Viewing Test Data - 5 The Graph display presents the following test data in a graphical format: ñ 40 harmonics including the fundamental, along the X axis. ñ the harmonic magnitude along the Y axis in absolute values. You can edit the graph to display the data according to % of limit on the Y-axis as described in the next section. ñ the maximum measured value of each harmonic is indicated by the height of each bar.
5 - Viewing Test Data Displaying Data According to % of Limit on the Y-Axis Click with the right mouse button on any area of the graph. This puts up the Edit Graph Attributes dialog box, in which you can reformat the y axis to display the data in percent of the specification limits rather than in absolute values. In this case the display appears as follows: The red line that appears across the display indicates the specification’s limits. All values above the line are outside the specification’s limits.
Viewing Test Data - 5 Table Display The Table display is used to view Quasi-stationary or Fluctuating harmonic data. Note that the amount of test data displayed in the table may be limited by the Span control. See “Using the Span Control” in chapter 6 for details. Note: You must have run post-processing in the Test window to generate data for the standard deviation column as well as the 50%, 75%, 90%, and 95% failure count columns of the table.
5 - Viewing Test Data ñ the number of failures for individual harmonics in the test to-date, as well as the number of failures for individual harmonics in the 2.5 minute window criteria. ñ the failure count that exceeds 50%, 75% , 90%, and 95% of the regulation’s limits. Failures are indicated in red and are enclosed in parentheses. When the data is sent to a printer, failures are enclosed in parentheses. Color printers will also print errors in red.
Viewing Test Data - 5 The Time-series display presents the following data for the selected harmonic: ñ the total time of the selected span along the X axis. ñ the magnitude of the specified harmonic along the Y axis in absolute values. You can edit the graph to display the data according to % of limit on the Y-axis as described in the following section. If the bar is green, it means that the present value is within the regulation’s specification.
5 - Viewing Test Data Displaying Data According to % of Limit on the Y-Axis Click with the right mouse button on any area of the graph. This puts up the Edit Graph Attributes dialog box, in which you can reformat the y axis to display the data in percent of the specification limits rather than in absolute values. In this case the display appears as follows: The red line that appears across the display indicates the specification’s limits.
Viewing Test Data - 5 Statistics Display The Statistics display presents a summary of the Quasi-stationary or Fluctuating harmonic data for the entire test. Note: If no data appears in this display, go back to the Test window and press the Run Post processing button to generate the statistics data. Statistics are generated from all of the test data when the test run is complete.
5 - Viewing Test Data Probability Display (for Quasi-stationary or Fluctuating harmonics) The Probability display shows the cumulative failure probability (or percentile) of the quasi-stationary or fluctuating harmonic data for the entire test. Note: If no data appears in this display, go back to the Test window and press the Run Post processing button to generate the probability data.. Probability calculations are performed from all of the test data.
Viewing Test Data - 5 Viewing 2.5 Minute Window Failures For fluctuating harmonic tests, limit values are more complex than those for quasi-stationary harmonics. The regulation for fluctuating harmonics allows values up to 1.5 times the limits for quasi-stationary harmonics during a maximum of 10% of any observation period of 2.5 minutes. This corresponds to 15 seconds. A 2.
5 - Viewing Test Data 2.5 Minute Failures On the Graph Display 2.
Viewing Test Data - 5 Viewing Voltage Fluctuations Pst Display The Pst display is used to view voltage fluctuations and flicker data. When the test is running, the Pst display is updated at the completion of each integration period. Note that the amount of test data displayed may be limited by the Span control. See “Using the Span Control” in chapter 6 for details. Note To edit the graph, click with the right mouse button on any area of the graph.
5 - Viewing Test Data Light green indicates that the maximum value is within the regulation’s specification. Light red indicates that one or more measured values are outside the regulation’s specification. The maximum component percentiles are always light green, since no failure criteria is specified for these by the regulation. ñ the present value of each component is indicated by the solid part of each bar. When the test is running (Rolling mode), this value is always the latest measured value.
Viewing Test Data - 5 The Probability display presents the following test data: ñ the magnitude of flicker perceptibility along the X axis (Pst = 1 is the threshold of irritability). The value is the flicker perceptibility level that is exceeded for x% of the samples as indicated by the corresponding Y-axis values. ñ the cumulative probability in percent along the Y axis. This data represents the flicker level associated with a given probability of occurrence.
5 - Viewing Test Data Distribution Display The Distribution display presents a summary of the Voltage fluctuations and Flicker test data. When the test is running, the Distribution display is updated at the completion of each integration period. Note that the amount of test data displayed may be limited by the Span control. See “Using the Span Control” in chapter 6 for details. Also, the Search Parameters control is not active in this display.
Viewing Test Data - 5 ñ the Rms Measurement area on the bottom of the screen provides a summary value of Dmax, Dc, and Dt voltage fluctuation failures. Summary values are the maximum value for each type within the presently displayed integration period. If dashes are displayed in the Rms Measurement area, it means that the test either never achieved or never exited the “steady-state” required by the regulation. Refer to the Glossary for information about steady-state.
5 - Viewing Test Data A green bar means that all values summarized by the bar are within the regulation’s specification. A red bar means that one or more values summarized by the bar are outside the regulation’s specification. ñ detailed rms information can be obtained by holding down the Shift key and double-clicking on a bar. This highlights the selected bar in white and puts up a dialog box which displays a report of the Dc failures, Dmax failures, or Dt failures represented by the bar.
Viewing Test Data - 5 The Flicker display presents the following data: ñ the total time of the selected range along the X axis. ñ the magnitude of flicker perceptibility units along the Y axis. This graph does not display failures. ñ the Rms Measurement area on the bottom of the screen provides a summary value of Dmax, Dc, and Dt voltage fluctuation failures. Summary values are the maximum value for each type within the presently displayed integration period.
5 - Viewing Test Data Editing the Graph Attributes To change the attributes or the settings of any of the graphs, ñ Click with the right mouse button on any area of the graph. This puts up the Edit Graph Attributes dialog box. From this dialog box you can select: 56 ñ the Maximum values of the x and the y axes. These are specified in the units that are presently displayed on the axes. The X axis is not configurable in all graphs.
Viewing Test Data - 5 Copying Graphs and Tables to the Clipboard Using the Print Screen keyboard key The easiest way to put screen information into the clipboard is to use the Print Screen keyboard key. This puts all of the information that is displayed on the screen into the Clipboard. From the Clipboard you can then paste the captured screen information into any application that accepts Clipboard graphics such as Freelance Graphics or Windows Paintbrush.
5 - Viewing Test Data Viewing Reports Reports are available in either Short form or Long form, and can be previewed in the Report window. User remarks can be added to a test file by selecting the Remarks menu tab. Menu tabs on the bottom of the screen let you quickly access each area. The Printer button sends your report to the default printer. NOTE: You must run Post processing to generate data for the long form reports.
Viewing Test Data - 5 Short Form Report The Short Form report includes summary information about the current test. This information fits on one page. The following is a sample short form report of a Fluctuating Current Harmonics test: IEC 1000-3-2/EN 61000-3-2 Fluctuating Current Harmonics Test Date Performed: 06/15/97 Test Executed By: Company Name: Device Under Test ID: Test ID: A.C.
5 - Viewing Test Data Long Form Report The long form report presents all of the information as the short-form report but also includes all of the final test data, which appears on subsequent pages of the report. The following is a sample long form report of a Fluctuating Current Harmonics test: Long-Form Report page #1 IEC 1000-3-2/EN 61000-3-2 Fluctuating Current Harmonics Test Date Performed: 05/10/96 Test Executed By: Company Name: Device Under Test ID: Test ID: A.C.
Viewing Test Data - 5 Long-Form Report page #2 Pre-Test Source Harmonics Data: ------------------------------Harmonic Limit Limit Max Max Number (%) (Abs) (%) (Abs) =========================================================================================== Fund. 100 120.020 2 0.2 0.240 0.004 0.005 3 0.9 1.080 0.040 0.049 4 0.2 0.240 0.006 0.007 5 0.4 0.480 0.048 0.058 6 0.2 0.240 0.001 0.002 7 0.3 0.360 0.065 0.078 8 0.2 0.240 0.001 0.001 9 0.2 0.240 0.059 0.071 10 0.2 0.240 0.005 0.006 11 0.1 0.120 0.
5 - Viewing Test Data Note For Voltage Fluctuations reports, depending on the number and length of the integration periods, the Final Test Data section of the report may include up to several dozen pages.
Viewing Test Data - 5 Long-Form Report page #4 Final Test Statistics: ---------------------Standard Maximum Maximum >50% >75% >90% >95% >100% 2.5-min Harmonic Limit Value Value of Limit of Limit of Limit of Limit of Limit Failures Number (A rms) (A rms) (% Limit) (Count) (Count) (Count) (Count) (Count) (Count) ================================================================================================= Fund. 1.1096 2 0.0074 0 0 0 0 0 0 3 0.5058 (0.9661) (191.0) 369 369 368 367 161 124 4 0.
6 Searching for Specific Test Data The toolbar on top of the display screen, which is referred to as the Navigator toolbar and is described in the beginning of chapter 5, is used to search for specific data in the test record. There are two ways to search for specific test data. Searching for Data While the Test is Running Using the Navigator toolbar while the test is running may prove to be slow unless you have a very fast PC with lots of memory.
6 - Searching for Specific Test Data Using the Span Control The span control applies to the Harmonics graph and table displays, the Pst display, the Probability display, and the Distribution display. It determines the range of test data that you want to examine in relation to the present cursor location. This is illustrated in the following figure. As shown in the following figure, the solid-colored part of each bar (either green or red), indicates the value at the present cursor position.
Searching for Specific Test Data - 6 Using the Zoom Control The zoom control applies to the Time Series display, the Rms display, and the Flicker display. The timeseries display only shows a limited number of data bars. Zooming in lets you view individual data points in the time series. Zooming out lets you view summarized information for larger blocks of measurement data. When the zoom factor is greater than 1:1, each bar represents the maximum value of two or more data points.
6 - Searching for Specific Test Data Obtaining Detailed Failure and Error Information Note: This feature is not available for the Flicker Display. For detailed failure and error information about a specific bar in a graphical display, proceed as follows: 1. Press the Shift key 2. While holding down the shift key, click on the bar for which you desire more information with the left mouse button. The following figure shows how a data bar is highlighted after it has been selected. 3.
7 Printing Printing Graphs and Tables Using the Print Pre-test command The Print Pre-test command prints the currently displayed Pre-test screen to the default printer. The printout is slightly reformatted from what you see on the display. Note that the Print Pre-test command does not copy any information to the Clipboard. 1. Select the Pre-test menu tab on the bottom of the screen and access the Pre-test Summary window. If no information appears in the display, run the pretest or open an existing test. 2.
7 - Printing 3. In the Print Report dialog box, select the document properties, page range, number of copies, or if you want collated copies. If you have access to more than one printer, click on the downarrow to choose a different printer. From the Report window 1. Select a Report window from either the View menu, or the Report menu tabs. (Short form or Long form). 2. In the Report window, click on the Print button. The entire report will automatically be sent to your default printer.
Printing 4. Click on OK to print the report. 5. Enter a filename in the dialog box that appears on the screen. The report will be saved in ASCII format in the file you specified. Until you change your printer selection to a different printer, the request for a filename dialog box will come up whenever you use any printing feature of the Agilent 14761A HFTS software.
A Specifications Supported or Referenced EN 61000-3-2 and EN 60555 Part 2 Standards IEC 555-2 EN 60555 Part 2 IEC 1000-4-7 EN 61000-3-2 IEC 1000-3-2 Supported or Referenced EN 61000-3-3 Standards IEC 725 IEC 868 IEC 868 Amendment 1 EN 61000-3-3 IEC 1000-3-3 PC Requirements Minimum: 486DX 33 Mhz 512 Kbytes of conventional memory 8 Mbytes of RAM 210 Mbyte IDE Hard Disk1 (4 Mbytes required for installation) Windows 3.1, or Windows for Workgroups 3.
A - Specifications Equipment Specifications (IEC Mode) IEC mode specifications are warranted over the ambient temperature range of 0 to 40° C. Model Agilent 6812B, 6841A Agilent 6813B, 6842A Agilent 6843A Number of Phases 1 1 1 Maximum Output Ratings Output Power rms Voltage 750 VA 300 V 1750 VA 300 V rms Current 6.
Specifications - A Ac Input Ratings and supplemental information Model Agilent 6841A Agilent 6842A Agilent 6843A Voltage Range (Vac) 87 - 106 Vac 104 - 127 Vac* 174 - 220 Vac 191 - 254 Vac 174 - 220 Vac* 191 - 254 Vac 180 - 254 VL-L (3Φ)* 342 - 456 VL-L (3Φ) Maximum Input Current (rms) 24 A (at 120 Vac) 28 A (at 100 Vac) 15 A (at 200/208 Vac) 13 A (at 230 Vac) 22 A (at 200/208 Vac) 20 A (at 220/230/240 Vac) 25 A per phase 15 A per phase Input Power (max) 2500 VA/1400 W 3800 VA/2600 W 8900 VA
B Glossary Quasi-stationary Harmonics Quasi-stationary or steady-state harmonic currents are produced by electronic equipment that generates non-varying levels of current distortion, where the amplitude of each harmonic remains constant over time. This equipment appears as an unchanging load on the ac mains. Examples include test and measurement instrumentation such as oscilloscopes and multimeters, electronic ballasts, and video display equipment.
B - Glossary Template Files Template files contain test-setup data that may be used in multiple tests. By eliminating a portion of the setup task, using template files can streamline the test process. Template information is included with the test data when the test is run. At the beginning of each test you can elect to use an existing template file when running your test, or you can create a new template for the test by entering new setup information in the Main and Test Setup screens.
Glossary - B Failures Failures are those conditions that will cause a test to fail the regulations. The number of failures are displayed in the status bar on the bottom of the screen. You can override the failure criteria by specifying an override percent in the Test Setup Advanced Options window. Test limits may be adjusted above or below the values specified by the regulation, but any adjustment above 100% will flag the test as invalid in the test report.
B - Glossary D(t) (Relative Voltage Change Characteristic) The change in rms voltage, relative to the nominal voltage, as a function of time and between periods when the voltage is in a steady-state condition for at least 1 second. D(t) must not be > 3% for more than 200 milliseconds continuously during a voltage change event. Dmax (Maximum Relative Voltage Change) The difference between maximum and minimum rms values of the voltage change characteristic relative to the nominal voltage. Dmax must be ≤ 4%.
C IEC Mode Command Summary Introduction The Agilent 6800-Series AC Power Source/Analyzer is designed to operate in Normal as well as IEC mode. In Normal mode, the ac source responds to all of the commands that program ac source operation. Normal mode commands are documented in the Agilent 6800 Series Programming Guide. In IEC mode, the Agilent 6800-Series AC Power Source/Analyzer provides full EN 61000-3-2/EN 60555 Part 2 and EN 61000-3-3 compliance test capability.
C - Command Summary Command Syntax CALCulate :INTegral :TIME selects the Pst integration time for flicker measurements :LIMit :UPPer [:DATA] :SMOothing FORMat [:DATA] :BORDer MEASure :ARRay :CURRent :HARMonic? :VOLTage :FLUCtuations :FLICker? :PST? :ALL? SENSe :CURRent :PREFerence :WINDow [:TYPE] SYSTem :CONFigure 82 sets various limits associated with rms voltage fluctuation testing for IEC 1000-3-3 turns the 1.
Command Summary - C CALCulate:INTegral:TIME This command selects the Pst integration time for IEC Flicker measurements. The parameter may only assume values of 1, 5, 10, and 15 minutes in accordance with IEC 868. The command will be accepted and may be queried, but will have no meaningful function unless the ac source is placed in IEC mode using the SYSTem:CONFigure command.
C - Command Summary CALCulate:LIMit:UPPer This command sets various limits associated with rms voltage fluctuations testing for IEC 1000-3-3. as described in the following table. All five parameters are type NRf. The order in which the five parameters are entered must correspond to the order in the table. vss delta Sets the maximum peak-to-peak variation of relative voltage1 that defines “steady-state”. At *RST this value is set to 0.0032. Note that this number is not specified by IEC 1000-3-3.
Command Summary - C FORMat This command specifies the response data format for the following queries: MEASure:ARRay:CURRent:DC? MEASure:ARRay:VOLTage:DC? MEASure:ARRay:CURRent:HARMonic[:AMPLitude]? MEASure:ARRay:VOLTage:FLUCutations:ALL? MEASure:ARRay:VOLTage:FLUCutations:FLICker? MEASure:ARRay:VOLTage:FLUCutations:PST? When ASCii is selected, the response format for these queries is NR3 Numeric Response Data. This format is selected at *RST.
C - Command Summary FORMat:BORDer This command sets the byte order of IEEE floating point values returned within Arbitrary Block Response Data. When NORMal is selected, the first byte sent is the sign bit and seven most significant bits of the exponent, and the last byte sent is the least significant byte of the mantissa. This ordering is most useful for big-endian controllers such as those that use Motorola processors.
Command Summary - C MEASure:ARRay:CURRent:HARMonic? This query returns an array of current harmonic magnitudes. Operation of the query is modified by the SYSTem:CONF command (see summary table under SYSTem:CONFigure). The parameter specifies the number of harmonic arrays to be returned in response to the query. If SYSTem:CONFigure specifies NORMal operation, the parameter is ignored (ie it is forced to 1).
C - Command Summary MEASure:ARRay:VOLTage:FLUCtuations:ALL? This query measures voltage fluctuations in accordance with the IEC 868 standard. It is only available when IEC mode is selected with SYSTem:CONFigure. The parameter specifies the number of Pst integration periods during which data will be returned in response to the query. This query returns the data structures associated with both the MEAS:ARR:VOLT:FLUC:FLIC query and the MEAS:ARR:VOLT:FLUC:PST query.
Command Summary - C 0 ↓ 99 0 ↓ 99 Record Number Error Code P_0.
C - Command Summary MEASure:ARRay:VOLTage:FLUCtuations:FLICker? This query measures voltage fluctuations in accordance with the IEC 868 standard. It is only available when IEC mode is selected with SYSTem:CONFigure. The parameter specifies the number of Pst integration periods during which voltage fluctuation arrays will be returned in response to the query.
Command Summary - C MEASure:ARRay:VOLTage:FLUCtuations:PST? This query measures voltage fluctuations in accordance with the IEC 868 standard. It is only available when IEC mode is selected with SYSTem:CONFigure. The parameter specifies the number of Pst integration periods for which data will be returned in response to the query. This query returns 1 data structure per specified integration period for a total of structures.
C - Command Summary SENSe:CURRent:PREFerence This command sets the phase reference for current harmonic phase measurements. If VOLTage is selected, the reference is the fundamental component of the measured output voltage. If CURRent is selected, the reference is the fundamental component of the measured output current.
Command Summary - C SYSTem:CONFigure This command sets the overall operating mode for the Agilent 6800-Series AC Power Source/Analyzers. The choices are normal mode, which causes the product to operate as a standard ac source, or IEC mode, which modifies the basic behavior of the transient and measurement systems to facilitate IEC measurements. SYSTem:CONFigure has a variety of global consequences that are summarized below: NORMAL MODE IEC MODE Base Sampling Rate 39.920792 kHz 38.
D Class Determination The following flowcharts document the class determination used by the Agilent 14761A HFTS software. Class determination is a function of the Pre-test. The flowcharts illustrate ñ the class determination process according to the device class that was selected in the Standard Options window ñ how a test is flagged as non-compliant based on class selection ñ how the pre-test limits are calculated.
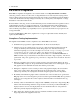
D - Class Determination Class A Device Selected 56#46 01 ;'5 %.#55 # 9#8'(14/! 01 /'#574'& ;'5 8#.7' +0 $170&5! /1614 01 ;'5 &4+8'0 &'8+%'! (.#) %.#55 5'.'%6+10 +08#.+& (.#) 6'56 010 %1/2.+#06 75' %.#55 # .+/+65 01 6'56 ;'5 .+/+6 18'44+&' '0#$.'&! .+/+65 .+/+65 .+/+6 18'44+&' '0& 01 .+/+6 18'44+&' ;'5 '0& Class A Limits Logic (EN 61000-3-2) 96 (.#) 6'56 010 %1/2.
Class Determination - D Class B Device Selected 56#46 75' %.#55 # .+/+65 01 6'56 ;'5 .+/+6 18'44+&' '0#$.'&! .+/+65 .+/+65 .+/+6 18'44+&' '0& 01 .+/+6 18'44+&' ;'5 ! '0& (.#) 6'56 010 %1/2.
D - Class Determination Class C Device Selected 56#46 .+/+65 (70&#/'06#. %744'06 TF *#4/10+% .+/+6 (70&#/'06#. %744'06 2( 01 219'4 ;'5 (#%614 18'44+&' '0#$.'&! TF *#4/10+% .+/+6 (70&#/'06#. %744'06 219'4 (#%614 18'44+&' (.#) 18'44+&' 219'4 (#%614 18'44+&' 01 6'56 ;'5 .+/+6 18'44+&' '0#$.'&! .+/+65 .+/+65 .+/+6 18'44+&' '0& 01 .+/+6 18'44+&' ;'5 ! '0& (.#) 6'56 010 %1/2.
Class Determination - D Class D Device Selected 56#46 01 ;'5 %.#55 & 9#8'(14/! 75' %.#55 # .+/+65 (14 #.. *#4/10+%5 (.#) %.#55 5'.'%6+10 +08#.+& '0& 01 9#665 ;'5 18'44+&' '0#$.'&! 01 75' %.#55 # /'#574'& 9#665 ;'5 01 8#.7' +0 8#.7' +0 $170&5! $170&5! .+/+65 O# 9 9#665 18'44+&' 75' %.#55 # .+/+65 O# 9 /'#574'& 8#.7' (.#) 18'44+&' 9#665 18'44+&' .+/+65 (14 1&& .+/+65 (14 1&& ;'5 18'44+&' *#4/10+%5 *#4/10+%5 01 6'56 ;'5 .+/+6 18'44+&' '0#$.'&! .+/+65 .+/+65 .
D - Class Determination EN 60555 Part 2 Regulation Selected 56#46 01 ;'5 %.#55 $ &'8+%'! 75' 75' %.#55 # .+/+65 %.#55 # .+/+65 01 /#+05 ;'5 81.6#)' 8! .+/+65 .+/+65 /#+05 81.65 01 6'56 ;'5 .+/+6 18'44+&' '0#$.'&! .+/+65 .+/+65 .+/+6 18'44+&' '0& 01 .+/+6 18'44+&' ;'5 ! '0& (.#) 6'56 010 %1/2.
Index —2— 2.
Index save as...
Index printing from the report window, 70 from the file menu, 69 from the report window, 70 Print Graph/Table command, 69 Print Screen command, 69 report dialog box,, 70 reports, 69 to a file, 70 probability display, 46, 50, 51 program commands measure array current harmonic?, 87 measure array voltage fluctuations all?, 88 measure array voltage fluctuations flicker?, 90 measure array voltage fluctuations pst?, 91 sense current preference, 92 sense window, 92 system configure, 93 programming commands calcula
Index report, 15 test, 15 test setup>, 15 viewing 2.
Agilent Sales and Support Offices For more information about Agilent Technologies test and measurement products, applications, services, and for a current sales office listing, visit our web site: http://www.agilent.com/find/tmdir You can also contact one of the following centers and ask for a test and measurement sales representative. United States: Agilent Technologies Test and Measurement Call Center P.O.
Manual Updates The following updates have been made to this manual since the print revision indicated on the title page. 5/30/00 All references to HP have been changed to Agilent. All references to HP-IB have been changed to GPIB. Information about Validation Mode has been added to page 36.