
User`s guide


1- 86 Agilent EasyEXPERT User’s Guide Vol. 1, Edition 1
Main GUI
Data Display
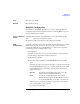
Data Display GUI
Setup Name This field just displays the name of the test setup used to get this test record.
X-Y Graph Plot This area displays the measurement result graph, traces, marker, cursor, and lines.
The Properties button opens
“Graph Properties (page 1-96)”.
Parameters This area lists the user-defined output parameters if the output parameters are set.
List Display This area displays the measurement result data list. The Properties button opens
“List Display Properties (page 1-97)”.
pin The Data Display window can keep up to 10 display layers. And the earliest layer
over 10 will be automatically deleted. This button is available when the window
keeps at least two layers. If this button shows the standing pin, the layer will be kept.
If this button shows the laid pin, the layer can be deleted.
Double clicking the tab gives the same result as this button.
X This button closes the selected display layer.
File menu Provides the following functions.
Switch to Append Mode /
Switch to Overwrite Mode
Used to switch the display mode.
Update Test Result Stores the information of the scale and the analysis
tools.
Delete Test Result Deletes the present display data or the selected
display layer.
Close This Display Closes the selected display layer.
Close All Displays Closes all display layers.
Save Image As... Opens the Save Image As... dialog box used to
specify the file name of the graph image to save.
See
Figure 1-7. Available data formats are the
BMP, EMF, GIF, and PNG.
Page Setup... Opens the Page Setup dialog box used to set the
print page.