
User`s guide


Agilent EasyEXPERT User’s Guide Vol. 1, Edition 1 1- 45
Main GUI
Tracer Test
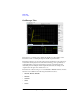
Time/division
Time scale value per division. Displayed on the top of the
graph. To change it, click on the displayed value and open the
Time Scale dialog box. Enter the scale value of the X axis
(time) per division in the dialog box.
Time Origin
Time origin value. Displayed on the bottom of the graph. To
change it, click on the displayed value and open the Time
Origin dialog box. Enter the origin value of the X axis (time) in
the dialog box.
Duration of measurement
Duration of the measurement for the presently-monitored sweep
step. Indicated by the green horizontal lines displayed on the
top and
button of the graph. Hence, you can observe the time
relationship between the measurement time and the waveform.
Vertical data/division and offset value
Y-axis scale value per division and offset value. Displayed on
the right of the graph respectively. To change them, click on the
displayed value and open the Data View dialog box. See
“Dialog box for changing data display” on page 1-45, for this
dialog box.
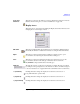
Dialog box for changing data display
This dialog box is opened by selecting the Setup > N. data name menu, or by
clicking on the scale or offset value shown on the right area of the graph display.
This is used for changing the Y-axis scale, offset, the color of the line and characters,
and the line thickness.
Clicking the color pattern opens the color palette for selecting color. The color
palette provides the function to add the custom colors.
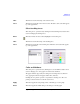
Sampling Setup
This dialog box is opened by selecting the Setup > Sampling menu. This is used for
setting up the sampling conditions of the waveform monitoring.
The target observing step is decided by the following combination:
• The ordinal number of the sweep step on the primary sweep source output
(VAR1 Step)
• The ordinal number of the sweep step on the secondary sweep source output
(VAR2 Step)