
User`s guide


1- 44 Agilent EasyEXPERT User’s Guide Vol. 1, Edition 1
Main GUI
Tracer Test
Time > Scale Opens the Time Scale dialog box. Enter the scale value of the X
axis (time) per division in the dialog box.
Time > Origin Opens the Time Origin dialog box. Enter the origin value of the
X axis (time) in the dialog box.
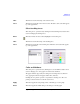
Sampling Opens the Sampling Setup dialog box. See “Sampling Setup”
on page 1-45.
N. data name The data names that are checked on the Data menu are listed.
Opens the Data View dialog box. See
“Dialog box for changing
data display” on page 1-45. Where, N is a serial number.
Window menu Provides the following functions.
Large Changes the window size to the prescribed large window.
Small Changes the window size to the prescribed small window.
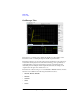
Monitor area This area displays a waveform graph in the center. All monitored waveforms are
displayed on this graph. A vertical marker is available to read out the values on all
waveforms at a certain time.
The waveforms and the relational information are organized by color. To change the
color, select the Setup > N. data name menu to open the Data View dialog box. See
“Dialog box for changing data display” on page 1-45, for this dialog box.
The display items in the monitor area are described below.
Marker position
Marker position (X-axis (time) data). Displayed on the upper
left of the graph. To move the marker position, use rotary knob
or mouse.
Data at Marker position
Y-axis (voltage or current) values at the marker position.
Displayed with the data names on the left of the graph
respectively.