
User`s guide


1- 38 Agilent EasyEXPERT User’s Guide Vol. 1, Edition 1
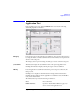
Main GUI
Tracer Test
The abnormal region can be defined by the point and drag operation. It
will be the square specified by the red grids. After defining the region,
this button’s signal color is changed to Red.
Red Abnormal region is effective. Clicking this button changes the button’s
signal color to Green.
Replay traces This button opens/closes the dialog box used for managing the record and replay of
traces. For the dialog box, see
“Replay traces” on page 1-39.
Capture a
reference trace
This button is used to capture the trace as the reference trace. Clicking this button
captures one reference trace. Up to 10 traces can be captured. To manage reference
traces, click the reference trace button.
Select reference
traces
This button opens/closes the dialog box used for managing reference traces
memorized by clicking the Capture button. For the dialog box, see
“Select reference
traces” on page 1-40.
Select tracking
traces
This button is available for the measurement result which contains at least two
traces by the append measurement. Tracking trace means each trace of this
measurement result. This button opens/closes the dialog box used for managing
tracking traces. For the dialog box, see
“Select tracking traces” on page 1-41.
Marker This button enables/disables the marker which can be moved on the active trace by
using rotary knob or mouse. The marker position X and Y coordinate values are
displayed in the upper left of the graph.
Tangent line This button enables the marker and enables/disables the tangent line for the marker
point. The line X-axis intercept, Y-axis intercept, and gradient values are displayed
in the upper right of the graph. The tangent line disables the regression line.
Regression line This button enables the marker and enables/disables the line which is given by the
regression calculation. The line X-axis intercept, Y-axis intercept, and gradient
values are displayed in the upper right of the graph. The regression line disables the
tangent line. The measurement data for the regression calculation can be specified
by the point and drag operation.
Oscilloscope View This button opens/closes the Oscilloscope View window used for monitoring the
waveforms of output signals. For the window, see
“Oscilloscope View” on page
1-42.