
User`s guide


Agilent EasyEXPERT User’s Guide Vol. 1, Edition 1 1- 37
Main GUI
Tracer Test
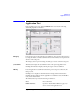
Graph Setup Tool
The graph setup tool provides the following GUI for setting the graph display.
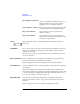
X-axis direction This button is used to set the X-axis direction, left to right () or right to left ().
Y-axis direction This button is used to set the Y-axis direction, down to up ( ) or up to down ( ).
Variable This field is used to set the X-axis/Y-axis variable name to plot.
Variable must be V Name or I Name used for sweep output or measurement.
Scale This button is used to set the X-axis/Y-axis scale, linear (LIN) or logarithm (LOG).
Polarity This button is used to set the X-axis/Y-axis polarity, plus (+) only, minus (-) only, or
both plus and minus (
). Both plus and minus () is available only for the linear
scale.
Option Tool
The following tool is available for changing the graph display.
Line/Dot This button is used to set the trace style, line or dot.
Cancel zoom This button is available for the graph zoomed in, and is used to return the graph
scale to the original setting. The graph can be zoomed in by the point and drag
operation.
Set stop condition
area
This button is used to set the abnormal region on the graph, and shows the present
status of the abnormal region setup by using the button’s signal color. While the
abnormal region is effective, the measurement is automatically stopped if the
measurement data is in the region.
Green Abnormal region has not been defined. Clicking this button changes the
button’s signal color to Yellow.
Yellow Status for defining the abnormal region. Clicking this button changes
the button’s signal color to Green.