
User`s guide


4- 14 Agilent EasyEXPERT User’s Guide Vol. 1, Edition 1
Function Details
I/V-t Sampling Measurement
1. When the Output Sequence is SEQUENTIAL, source channels start the Source
value output in order, and the last source channel starts the Base value output
(Starts sampling). See
“Source Output Sequence and Time Origin” on page
4-18.
When the Output Sequence is SIMULTANEOUS, source channels start the Base
value output simultaneously (Starts sampling).
Base value is available for all output channels for the SIMULTANEOUS mode
and the last source channel for the SEQUENTIAL mode.
2. Base Hold Time later, the source channels change the output to the Source value.
The channels keep the value until the end of the sampling measurement.
3. Another Hold Time later, the measurement channel starts measurement for the
first sampling point. If multiple channels are used, the channels perform
measurement in order. See
“Multiple Measurement Channels” on page 4-69.
4. After that, the following operation is repeated with the specified time Interval.
This operation is repeated until the number of measurement result data reaches
the specified No of Samples of measurement data.
• Measurement channels start measurement if they are ready to measure.
• Measurement channels keep the condition if they are busy.
For the log sampling, the B1500 holds only the data that can be plotted on the
log scale in the same distance as close as possible. Only the held data is counted
in the number of measurement result data.
For the linear sampling with Interval < 2 ms, if the total measurement time runs
over the specified time Interval
No of Samples, the sampling measurement will
be stopped even if the number of measurement result data is less than the
specified No of Samples.
5. The source channels stop the output, and the I/V-t sampling measurement is
completed.
If the bias hold function is enabled, the source channels force the Base or Source
value.
NOTE
Time data and index
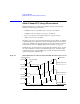
For the log sampling, the recorded data will be only the data that can be plotted on
the log scale in the same distance as close as possible. The index of the first data is
1. And the index of the following data will increase by 1. For the linear sampling,
see “Time Data and Index” on page 4-17.