
User`s guide


Agilent EasyEXPERT User’s Guide Vol. 1, Edition 1 2- 43
Classic Test Definition
Auto Analysis Setup
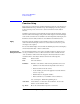
Auto Analysis Setup
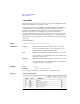
This setup screen is displayed by clicking the Auto Analysis Setup tab of the I/V
Sweep / Multi Channel I/V Sweep / I/V List Sweep / I/V-t Sampling / C-V Sweep /
Direct Control test setup screen, and is used to set the automatic analysis function.
When a measurement finishes, the function automatically draws lines, a marker, or
both on the X-Y Graph of the Data Display window.
You can set up two lines and one marker for the automatic analysis function.
In the Line 1 and Line 2 areas, you can set up the lines to be drawn.
In the Marker area, you can set up the marker.
Apply This button performs calculation of the definition in this screen. If this button is
clicked when the Data Display window associated with this test has been opened,
the display is also updated.
The associated Data Display window will be the Data Display window that displays
the last measurement data or that is recalled at last.
Interpolation Mode Check this box to enable the interpolation mode. You can position marker between
measurement points.
Line 1, Line 2 This area sets the line 1 or line 2 automatically displayed and moved to the specified
position after the measurement.
Enable Check this box to enable the line.
Fix Check this box to fix the line on the graph after the auto
analysis is performed. Remove the check to make the line free.
Type Select one of the available line types listed below.
Axis Axis effective for the line. Specify one from Y1 to Y8.
First Point See the following description for the line you selected.
Second Point See the following description for the line you selected.
Available line types:
• “Normal line”: For drawing a line between any two points.
• “Gradient line”: For drawing a line through any point with a specified gradient.
• “Tangent line”: For drawing a tangent line to a measurement point.