
User`s guide


Agilent EasyEXPERT User’s Guide Vol. 1, Edition 1 1- 107
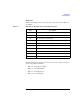
Main GUI
Data Display
X-Y Graph clicking the mouse
wheel
Same as clicking the rotary knob.
This is effective if the mouse properties assign the center button
functions to the wheel button.
List Display dragging a column
heading
Moves the column.
dragging boundary
of the column
Changes the width of the column.
clicking on a row in
the table
Moves the marker to the corresponding position.
moving the scroll
bar
Changes the data displayed in the List Display area.
Scroll is effective for both portrait and landscape.
rotating the mouse
wheel
Changes the data displayed in the List Display area.
Others
clicking on a tab
a
under the tool bar
Specifies the display layer for the data display and analysis.
double clicking on
a tab
a
under the
tool bar
Changes the status of the pin marked to the display layer.
Standing pin must be marked to the display layer to be kept.
Laid pin is marked to the display layer under the automatic
delete.
dragging boundary
of the display area
Adjusts the size of the display area (X-Y Graph, List Display,
Parameters) without changing the window size.
dragging the frame
of the Data Display
window
Changes the window size with adjusting the size of the display
area (X-Y Graph, List Display, Parameters).
a. Tab is displayed if the display mode is Append and the test result record contains the append
measurement data.
Location Operation Description