
User`s guide


1- 106 Agilent EasyEXPERT User’s Guide Vol. 1, Edition 1
Main GUI
Data Display
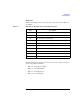
Table 1-11 Mouse/Touch Panel Operations on Data Display Window
Location Operation Description
X-Y Graph clicking on the left
Y axis
Activates the Y1 data.
clicking on the
right Y axis
Activates the data of the right Y axis, or changes the active data
if it is already active.
clicking on a plot Moves the marker to the position of the mouse pointer if the
marker is displayed on the graph.
clicking on a cursor Specifies the active cursor if multiple cursors are displayed.
dragging a cursor Moves the cursor.
clicking on a line Specifies the active line if multiple lines are displayed.
clicking on a text Selects the text.
Clicking with pressing the Shift key on the keyboard selects
multiple texts.
dragging a text Moves the text.
clicking on a
pointer
Selects the pointer.
Clicking with pressing the Shift key on the keyboard selects
multiple pointers.
clicking on a
description of
pointer
Selects the description of pointer.
Clicking with pressing the Shift key on the key board selects
multiple descriptions of pointers.
dragging a
description of
pointer
Moves the description of pointer.
rotating the mouse
wheel
Moves the marker if the marker is displayed on the graph,
moves the pointer if the pointer is selected, or adjusts the slope
of the gradient line if it is in the slope adjustment mode (Line >
Adjust Gradient).