
User`s guide


1- 104 Agilent EasyEXPERT User’s Guide Vol. 1, Edition 1
Main GUI
Data Display
Table 1-7 Controlling X-Y Graph
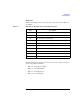
Table 1-8 Controlling Marker
Key Description
S Shortcut to View > Auto Scale
Z Shortcut to View > Zoom In
Shift+Z Shortcut to View > Zoom Out
Ctrl+Z Shortcut to View > Cancel Scaling
Y Changes the active data, Y1 Y2 ... Y8 Y1
R Activates the right Y axis and changes the data set to the axis,
Y2
Y3 ... Y8 Y2
W Shortcut to View > Graph Legend ON/OFF
K Shortcut to View > Line Information ON/OFF
Key Description
M Shortcut to Marker > Marker ON/OFF
I Shortcut to Marker > Interpolation ON/OFF
F
Moves the marker +1
a
in the VAR1 direction
a. Multiply 1/10 if the interpolation is ON.
Shift+F
Moves the marker +10
a
in the VAR1 direction
B
Moves the marker -1
a
in the VAR1 direction
Shift+B
Moves the marker -10
a
in the VAR1 direction
P
Moves the marker +1
a
in the VAR2 direction
Shift+P
Moves the marker -1
a
in the VAR2 direction
J Shortcut to Marker > Go To...
X Shortcut to Marker > Go To Maximum
N Shortcut to Marker > Go To Minimum