
User`s guide


1- 96 Agilent EasyEXPERT User’s Guide Vol. 1, Edition 1
Main GUI
Data Display
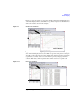
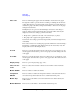
Graph Properties
This dialog box is opened by clicking the Properties... button in the X-Y Graph Plot
area or by selecting Edit > Graph Properties..., and is used to set the graph plot area.
Click the OK button to apply the setup and close this dialog box.
Effective Area This area provides the following check box.
Logo ON Displays the Agilent logo at the upper left of the graph area.
Grid ON Displays the grid on the graph.
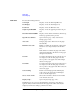
Setup Summary
ON
This is valid only for the I/V Sweep and Multi Channel I/V
Sweep classic tests. Displays the channel setup summary at the
bottom of the graph area. See
“Setup Summary” on page 1-101.
Graph Color This area is used to set the color map for the graph plot area. You can change the
color of the background, text, graph grid, and line/cursor. The color palette is
opened by clicking the pattern of the item.
Graph Trace Color This area is used to set visibility, color, and thickness of the data traces Y1 to Y8
plotted on the graph. The color palette is opened by clicking the pattern of the item.
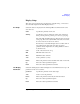
Log Scale This area is used to set the maximum number of decades to show the minor ticks on
the log axis. If the number of graph decades is less than or equal to the entered
value, the minor ticks are displayed. If it is greater than the entered value, the minor
ticks are not displayed.
Text Size This area is used to set the font size for the graph. The available settings are Largest,
Large, Medium, Small, Smallest, and Fixed. For settings other than Fixed, the
appropriate size is automatically selected. For Fixed, a font size entry field is
provided, and the specified font size is always applied.
X/Y Axis Title Font size for the axis title
Scale Font size for the X and Y coordinate values
Legend Font size for the graph legend