
User`s guide


1- 92 Agilent EasyEXPERT User’s Guide Vol. 1, Edition 1
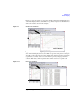
Main GUI
Data Display
Gradient... Opens the Gradient Value dialog box used to
specify the gradient value of the gradient line.
You can draw a line as shown below:
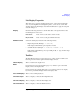
1. Set Line 1 or Line 2 on.
2. Select a Line Mode.
Normal A line and two cursors appear. Move cursors to the points
where the line passes through.
Gradient A line and a cursor appear. Move cursor to the point where
the line passes through. Enable Adjust Gradient function,
then increase/decrease the gradient of the line by using the
rotary knob or the mouse wheel.
Tangent A line appears. Set the marker on. The tangent line appears
on the marker point.
Regression A line and two cursors appear. Move cursors for specifying
the measurement data used for the regression calculation.
The calculation is executed by using the data included in the
square drawn by the extended cross cursor lines. For the
subordinate sweep measurement data, specify the data curve
by using the marker.
Fix Fixes the line on the graph.
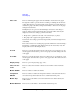
Figure 1-11 Line Mode
FXUVRUV
FXUVRU
JUDGLHQW
PDUNHU
GDWDFXUYH
FXUVRUV
PHDVXUHGGDWD
5HJUHVVLRQOLQH
7DQJHQWOLQH
*UDGLHQWOLQH1RUPDOOLQH