
User`s guide


Agilent EasyEXPERT User’s Guide Vol. 1, Edition 1 1- 91
Main GUI
Data Display
1. Graph scale is optimized for the data on the selected layer (top layer).
2. The graph scale is applied to the graph in all layers.
Note that auto scaling is performed independently for the left and right Y axes.
Marker menu Marker can move on the measurement data curve. The Marker menu provides the
following six functions.
Marker ON/OFF Enables or disables the marker.
Interpolation ON/OFF Enables or disables the interpolation function of
measurement data. You can read the interpolation
data between two actual measurement points.
Skip Moves the marker to the next measurement curve
that is added by the VAR2 variable.
Go To Maximum Moves the marker to the maximum value point.
Go To Minimum Moves the marker to the minimum value point.
Go To... Opens the Direct Marker/Cursor dialog box used to
specify the coordinate values to move the marker.
Cursor menu Cursor can move anywhere on the graph. The Cursor menu provides the following
three functions.
Cursor ON/OFF Enables or disables the cursor.
Go to Marker Moves the cursor to the marker position.
Go to... Opens the Direct Marker/Cursor dialog box used to
specify the coordinate values to move the cursor.
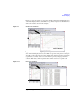
Line menu Provides the following five functions. When a line is enabled, gradient, X-intercept,
and Y-intercept are displayed in the graph. See
Figure 1-11.
Line 1 ON/OFF Enables or disables line 1.
Line 2 ON/OFF Enables or disables line 2.
Line Mode Selects the line mode: normal, gradient, tangent,
regression, or fix.
Adjust Gradient Available when a gradient line is active. Checking
this function enables the rotary knob and the mouse
wheel to increase/decrease the gradient of the line.
Unchecking this function, clicking the rotary knob,
or clicking the mouse wheel disables this function.