
User`s guide


Agilent EasyEXPERT User’s Guide Vol. 1, Edition 1 1- 89
Main GUI
Data Display
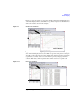
Figure 1-9 shows the graph copy and paste example. Click the X-Y Graph Plot area
on the Data Display window, select Edit > Copy menu, and paste it to WordPad. You
will see the result as shown in this example.
Figure 1-9 Graph Copy and Paste
Figure 1-10 shows the list copy and paste example. Click a line of the List Display
area on the Data Display window, select Edit > Copy menu, and paste it to Notepad.
You will see the result as shown in this example. The data in Notepad is a CSV data
(separated by a comma). Save it as a text file and open it by using a spreadsheet
software. Each data (comma separated value) will be entered to a separate cell.
Figure 1-10 List Copy and Paste
&RS\WR&OLSERDUG
3DVWHWR:RUG3DG
&RS\WR&OLSERDUG
3DVWHWR1RWHSDG