
Specifications


16
Configuring
ΦΦ
M
Using this procedure, you will learn
how to create a phase-modulated RF
carrier with the following character-
istics:
•RF output frequency set to 4.0 GHz
•RF output amplitude set to 0 dBm
•
ΦM deviation set to 0.25 l radians
•
ΦM rate set to 30 kHz
Instruction Note
1. Press [Preset].
2. Press [frequency] > [4] > {GHz}. The FREQUENCY area of the display now reads
4.000 000 000 00 GHz.
Instruction Note
1. Press [Amplitude] > [0] > {dBm}. The AMPLITUDE area of the display now reads
0.00 dBm.
Instruction Note
1. Press the [FM/ΦM] hardkey.
2. Press the {FM ΦM} softkey. The first level menu of ΦM softkeys is displayed.
3. Press {ΦM Dev} > [.25] > [pi rad]. This changes the ΦM deviation to 0.25 l radians.
Instruction Note
1. Press {ΦM Rate} > [10] > {kHz}. This sets the ΦM rate to 10 kHz.
Instruction Note
1. Press {ΦM Off On}. The ΦM annunciator is activated, indicating that
you have enabled phase modulation.
2. Press [RF On/Off]. The RF ON annuciator is activated, indicating
that the signal is now available at the
RF OUTPUT connector.
Setting the RF output frequency
Setting the RF output amplitude
Setting the
ΦΦ
M deviation
Setting the
ΦΦ
M rate
Activating
ΦΦ
M
The signal generator is now config-
ured to output a 0 dBm, phase-mod-
ulated carrier at 4 GHz with the
ΦM
deviation set to 0.25 – radians and
the
ΦM rate set to 10 kHz. The shape
of the waveform is a sinewave.
(Notice that sine is the default for
the
ΦM Waveform softkey. Press
[More (1 of 2)] to see the softkey.)
Follow these remaining steps to
output the phase-modulated signal.
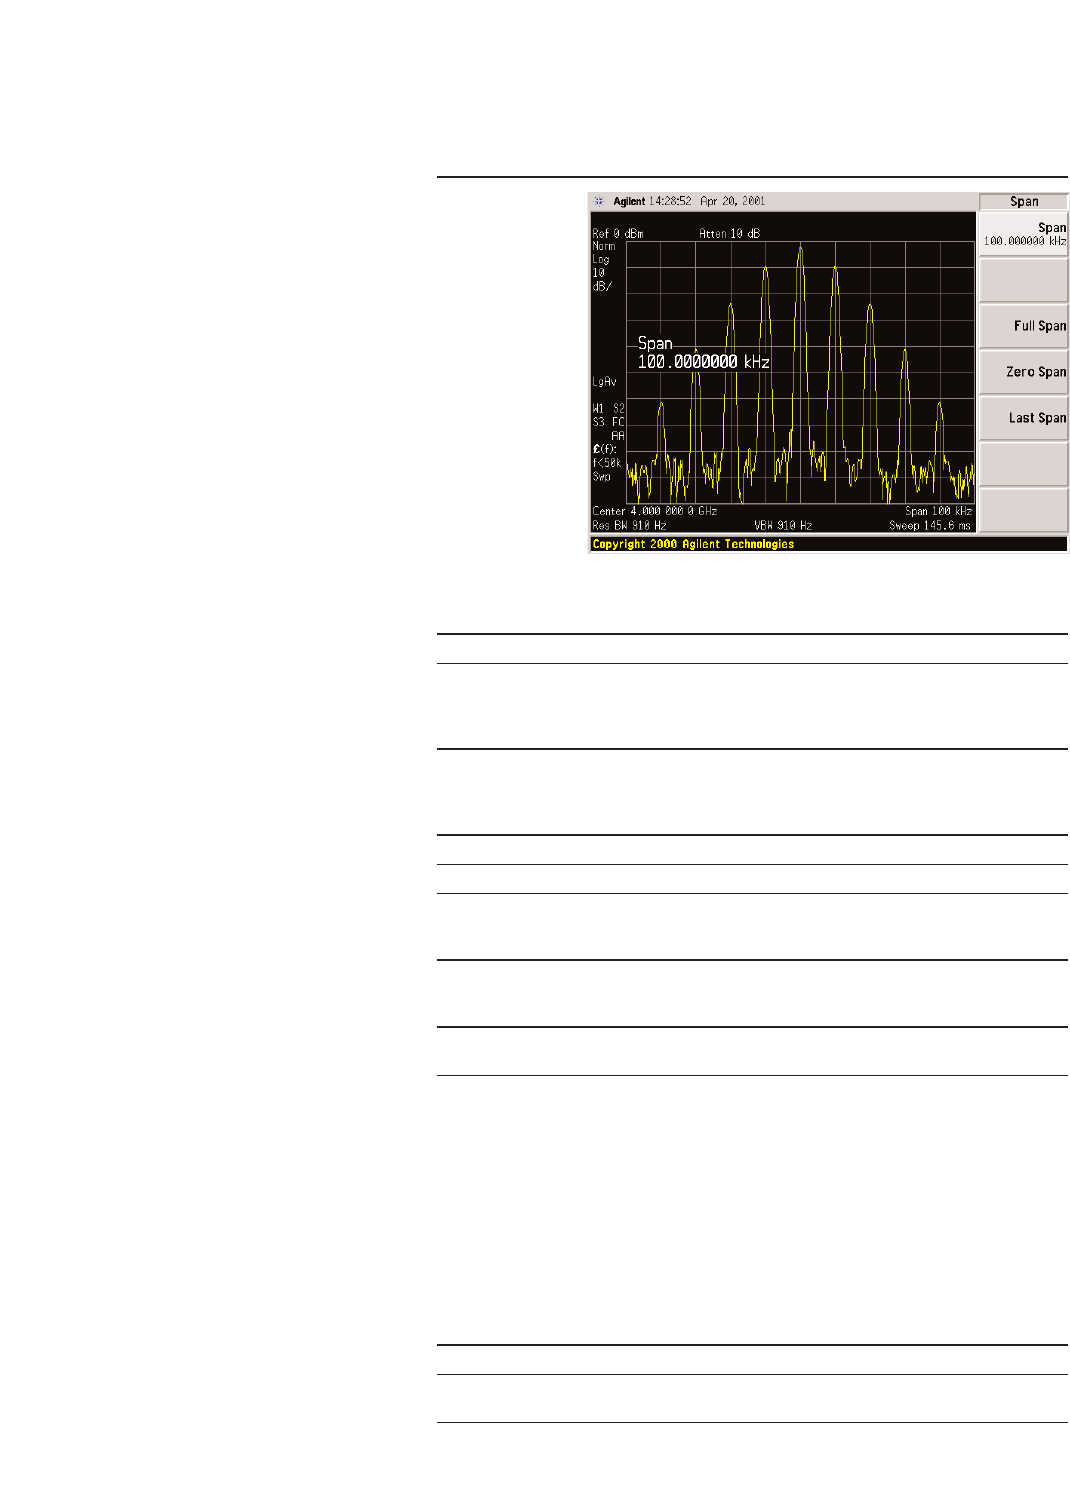
Figure 4:
ΦΦ
M
Instruction Note
1. Press [Preset].
2. Press [Frequency] > [4] > {GHz}. The Center FREQUENCY area of the display now
reads
4.000 000 00 GHz.
3. Press [Span] > [100] > {kHz}. The Span are of the display now reads 100 kHz.
The display on the PSA should now match
Figure 4.
Viewing the signal on an Agilent E4440A
PSA spectrum analyzer