
User`s guide
Agilent PXT Wireless Communications Test Set
User’s Guide
80
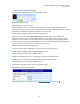
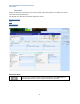
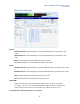
For example, in the picture above the channel bandwidth is 10 MHz and there are 9 PMI subband aperiodic
reports from the UE. The median CQI for codeword 0 and 1 has been calculated for over 100 reports and
has a Wideband Median CQI value equal to 9. All the reports of CQI for codeword 0 have a value of 9 so
we can observe 100 reports under the “0” column of the matrix for the differential CQI report.
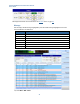
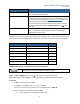
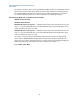
After Running the Median CQI, the following results are available:
Wideband median CQI Code 0
Wideband median CQI Code 1
Wideband CQI Code 0 in the range of +/- 1: Displays the percentage of how many CQI reports are in the
range +1/-1 from the medium CQI code 0. For example, 100% will indicate that all the CQI code 0 reports
used for the medium are within +1/-1 range.
Wideband CQI Code 1 in the range of +/- 1: Displays the percentage of how many CQI reports are in the
range +1/-1 from the medium CQI code 1. For example, 100% will indicate that all the CQI code 1 reports
used for the medium are within +1/-1 range.
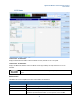
For example, in the picture above the median CQI for codeword 0 and 1 has been calculated over 100
reports and has a Wideband Median CQI value equal to 9. All the reports of CQI for codeword 0 have a
value of 9 so we can observe 100 reports under the “0” column of the matrix for the differential CQI report.
Wideband CQI Code 0 and 1 indicate 100% since all the reports are in the range 9 +/-1,
Key Path: Mode > BSE > Meas