
User`s guide

Agilent PXT Wireless Communications Test Set
User’s Guide
29
Amplitude Offsets Between Frequency Points
If mobile station testing is performed at frequencies that are not present in the table, the test set uses an
offset based on a linear interpolation using the two frequency points adjacent to it.
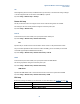
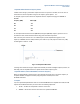
For example, Figure 2-2, below shows four amplitude offsets for frequencies ranging from 890 MHz to
920 MHz.
Frequency (MHz) Offset (dB)
890 -1.00
900 -2.00
910 -3.00
920 -4.00
For test frequencies between the lowest (890 MHz) and highest (920 MHz) frequency points that are not
entered in the table, the PXT calculates offsets using piece-wise linear interpolation.
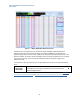
Each of the four points is shown on a non-scaled frequency versus amplitude offset graph. At a test
frequency of 895 MHz, which is midway between point number one (-1 dB) and point number two (-2 dB)
the PXT applies an offset of -1.5 dB.
Figure 2-2 Interpolated Offset Value
If testing is done outside the range of frequencies bounded by the lowest and highest frequency entries, the
PXT simply uses the amplitude offset that is paired with the nearest frequency point.
Amplitude Offsets, Channel Bandwidths, and Center frequency
Offsets are applied based on center frequency. The PXT finds the closest value to the centre frequency of
the uplink/downlink and applies this offset (using interpolation if needed) to the entire
bandwidth/subcarriers.
Examples
If you have specified amplitude offset values for 2.5 GHz and 800 MHz in the amplitude offset table, the PXT
responds as described below when you set the PXT to the following frequencies:
1. 1.5 GHz – the PXT uses interpolation to find the correct value.
2. 350 MHz – the PXT uses the same offset value as is specified for 800 MHz.