
User`s guide


Agilent PXT Wireless Communications Test Set
User’s Guide
219
Error Vector Measurement
Key Path:
Mode > SA > LTE > UL Demodulation > Error Vector
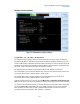
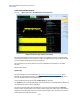
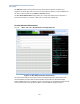
Figure 6-18: Error Vector Spectrum measurement
The Error Vector measurement presents the EVM results in two graphics. The Error Vector Spectrum
shows the EVM result of each subcarrier for the selected symbol – the horizontal axis is subcarrier index.
The Error Vector Time graphic has symbol index as the horizontal axis and displays the EVM value of all
subcarriers for a symbol as a stack of points. So the Error Vector Time graphic is a summary view of all
resource element EVM values; and the Error Vector Spectrum graphic is a detailed view where it is
possible to observe the EVM value of a particular resource element.
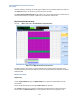
Measurement Setup
Access the following settings by selecting the Meas Setup front-panel key.
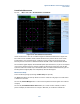
The upper Scale setting scales the Error Vector Spectrum graphic. The lower Scale setting scales the
Error Vector Time graphic.
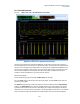
The Symbol setting selects the symbol index within the measured subframe. Use the Target Subframe
setting in the Uplink Config menu to select the required subframe for this measurement. The selected
symbol moves the marker on the Error Vector Time display. The marker value, displayed in the bottom
right-hand corner of the Error Vector Time graphic, is the average EVM for all subcarriers on the selected
symbol. The selected symbol also determines the symbol used for the Error Vector Spectrum display.