
User`s guide


Signal Analyzer Mode 4
E6651A User’s Guide 71
Flatness Analysis
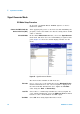
Flatness Analysis mode of the Test Set allows for the
measurement of the difference in power intensity among
spectral components. Access this window from the Uplink
Measurement Menu.
Figure 42 Flatness Analysis Window
Three sub- windows are provided in the Flatness Analysis
Window:
I/Q Constellation This window displays a constellation graph of the currently
selected subcarrier. Select the subcarrier using the SubCarrier
menu option.
Subcarrier Power
Table
This window displays the power value for each subcarrier.
Use the SubCarrier menu option to select the value of interest
for display.
Subcarrier Group
Average Power
This window displays the difference between the average
power of a group of subcarriers and the total average power.
One selection is available from the Flatness Menu:
SubCarrier Use to select the subcarrier value of interest to be
highlighted in the Measurement Window.