
User`s guide


Signal Analyzer Mode 4
E6651A User’s Guide 65
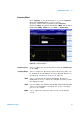
Information The Information Window displays signal information and a
time- domain waveform of the signal. The signal information
includes the detected preamble's cell ID, segment ID,
measured frequency offset, and the preamble's EVM.
Additionally, for a downlink symbol with Symbol Index = 0,
the pilot EVM average value is given. Otherwise, the symbol
data EVM average is provided. The waveform graph in the
Information Window provides a time domain view of the
input data used for analysis. This view displays data for a
single frame in the time domain providing the length of the
frame and the relative power of different components of the
frame.
Power Spectrum This window displays a frequency domain subcarrier
spectrum graph of the currently selected symbol. This view
can be used to display the number of subcarriers, subcarrier
usage, and the relative powers of the subcarriers.
Two selections are available from the Modulation Menu:
FREQ. Offset Use to apply the offset specified in the Frequency menu to
the measured carrier's frequency.
Symbol Use to select the specific symbol index for detailed analysis.
For downlink analysis, the symbol index range is 0- 26 with
0 being the preamble. For uplink analysis, the symbol index
range is 0- 11.
NOTE
Note that Position 0 in the Processing Symbol Index corresponds to
Position 3 in the Original Symbol Index.