
Technical data


Chapter 19 301
TD-SCDMA Programming Commands
Power vs. Time (PvT)
TD-SCDMA Programming Commands
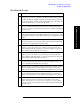
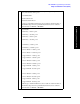
TD-SCDMA PvT results
Index Result Parameter
0 Overall Pass/Fail result shows the limit check result of Off power before,
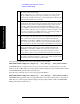
average power over -33rd ~ -14th chip, and Off power after to their upper limit:
-65 dBm, -50 dBm and -65 dBm respectively. Only when all these 3 powers are
below their upper limits, can this overall pass/fail result be pass. This is the only
pass fail result. (0.0 = pass, 1.0 = fail, -1.0: Not tested)
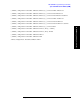
1 Mean power is the mean power (in dBm) of the range specified by Analysis
Time Slot and Measurement Time Slots in the most recently acquired data. If
averaging is on and average number is N, mean power is calculated after N PVT
traces are merged.
2 Burst width is the width of the first set of continuous active slots in the range
specified by Analysis Time slot and Measured Time Slots. If averaging is on and
average number is N, burst width result is calculated by averaging N burst width
results.
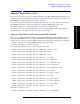
3 Burst start time is the start time of the burst referring to the start of the analysis
interval. If averaging is on and average number is N, the final burst width results
is calculated by averaging N burst start time results.
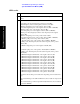
4 Ramp up time is the time difference between 10% and 90% voltage points
(relative to peak) on the positive slope of the burst, here burst has the same
meaning in Burst width. If averaging is on and average number is N, rump up
time is calculated after N PVT traces are merged.
5 Ramp down time is the time difference between 90% and 10% voltage points
(relative to peak) on the negative slope of the burst, here burst has the same
meaning in Burst width. If averaging is on and average number is N, rump down
time is calculated after N PVT traces are merged.
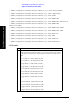
6 Off power is calculated as the averaged power between the -48th and -16th chip
before the burst start time. If average is on and average number is N, the off
power is calculated after N PVT traces are merged.
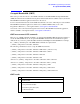
7 Maximum power is the maximum peak level in the range specified by Analysis
Time Slot and Measured Time Slots (in dBm). If average is on and average
number is N, the maximum power is calculated after N PVT traces are merged.
8 Minimum power is the minimum peak level in the range specified by Analysis
Time Slot and Measured Time Slots (in dBm). If average is on and average
number is N, the minimum power is calculated after N PVT traces are merged.
9 Trace sample interval is a floating point number representing the time between
samples of the merged envelop trace data, which could be read by using
FETCh:LSEQuencer<l>:ACQuire<m>:ASTep<n>:TDPVt:TRACe?
If average is on and average number is N, this result is calculated after N PVT
traces are merged.