
Technical data


Chapter 1 17
What is the Sequence Analyzer?
Example Sequence: Variable Analysis Intervals
What is the Sequence Analyzer?
Example Sequence: Variable Analysis Intervals
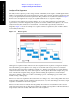
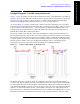
Figure 1-7 shows an example of a data sequence that has three bursts of data. Each burst is at a different
frequency; therefore, three different acquisitions must set up in the analyzer list sequencer to capture this
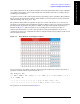
data. The associated spreadsheet is shown in Figure 1-8. Each acquisition starts at the burst trigger,
because the Input Trigger Delay parameter has been set to zero for each acquisition.
As shown in Figure 1-7, the first acquisition has a duration of 0.72 ms, and includes only one analysis
interval. The interval starts 0.02 ms after the burst trigger, and lasts for 0.7 ms. These values are entered
in the spreadsheet as shown in Figure 1-8. Also entered there is a Measurement Bitmap value of 111
(indicating that the measurements done on this analysis interval are the three basic measurements of
Transmit Power, Phase Error and Frequency Error).
The second acquisition has a duration of 0.74 ms, and includes two analysis intervals rather than one.
The first analysis interval is offset from the start of the acquisition by 0.195 ms and is 0.1 ms in duration.
The measurements are the same as for the previous acquisition (that is, the Measurement Bitmap value is
111 again). However, for the second analysis interval (which is offset from the start of the acquisition by
0.445 ms and has a duration of 0.1 ms), the Measurement Bitmap value is 11 (indicating that the
measurements performed on this data are Basic Transmit Power and Basic Phase Error).
Figure 1-7 Sequence with Variable Analysis Intervals
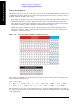
The third acquisition has a duration of 0.74 ms, and includes three analysis intervals which happen to
overlap in time. The first analysis interval is offset 0.02 ms from the start of the acquisition and lasts 0.7
ms, during which time the basic measurements of Transmit Power, Phase Error and Frequency Error are
done (Measurement Bitmap value 111). The second analysis uses some of the same data used in the first
analysis; it is offset 0.195 ms after the start of the acquisition and lasts 0.1 ms, during which time the
basic measurements of Transmit Power and Phase Error are done (Measurement Bitmap value 11). The
third analysis interval is offset 0.445 ms from the start of the acquisition, and lasts for 0.1 ms, during