
Technical data


Chapter 11 167
Example Test Scenarios
Verification Example
Example Test Scenarios
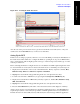
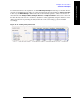
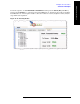
To add measurements to the acquisition, we click Edit Analysis Steps and add steps to the table. For the
selected step (highlighted in the table), we select a measurements from the checkboxes (
Basic Tx Power
in this case); the
Meas Bitmap column in the table is automatically updated to reflect our selection of
measurements. The
Analysis Offset, Analysis Interval, and Expected Power values can be entered in
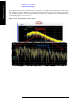
the table directly, but it is more convenient to adjust these values graphically, using the slider bars on the
display; the blue bars representing the analysis intervals on the screen change position and width
accordingly.
Figure 11-22. Adding Analysis Intervals