
Technical data


Chapter 11 163
Example Test Scenarios
Verification Example
Example Test Scenarios
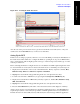
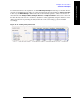
On the test set, we select the IQ Analyzer mode, and the Complex Spectrum measurement. We set the
center frequency to 1950 MHz, and verify that a strong uplink signal is present.
Figure 11-16. Verifying the “All Up” Uplink Signal
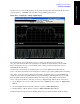
The uplink signal is fixed at maximum power, according to the instructions encoded in the
All_Up.wfm waveform. The next step will be to use a different waveform file for the downlink.
Before changing it, however, we use the DUT control software to shut down the mobile device’s
W-CDMA mode temporarily.
On the test set’s Source menu, as described before, we select an ARB waveform (this time the
ILPC.wfm waveform, which encodes instructions to ramp the power of the uplink signal down and up.)
Once again, we use the control application for the DUT to instruct the device to start W-CDMA and
acquire the pilot. Then we instruct the DUT to begin transmitting its uplink signal to the test set. This
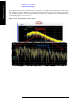
time, the uplink signal should exhibit the falling and rising power profile which is encoded in the
ILPC.wfm waveform file. To verify this, we need to configure the IQ Analyzer mode of the test set:
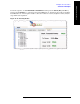
1. Set the Trigger mode to Video, with an absolute level of 0 dBm. The key sequence is:
Trigger, Video,
Video, 0.
2. Select the IQ Waveform measurement. The key sequence is:
Meas, IQ Waveform.
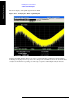
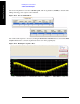
3. Set Meas Time to 140 ms. The key sequence is:
Meas Setup, Meas Time, 140, ms.
In this measurement setup, the expected falling and rising power profile should be visible in the IQ