
Technical data


16 Chapter 1
What is the Sequence Analyzer?
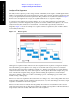
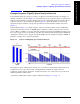
Example Sequence: Equally Spaced Analysis Intervals
What is the Sequence Analyzer?
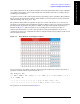
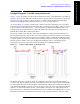
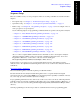
Figure 1-6. Sequence Spreadsheet
The first row of entries in the spreadsheet sets up the acquisition settings (as represented by the first 18
parameters in the row) for the first acquisition. For example, “1” in the first column specifies that this is
the first acquisition in the sequence, “PGSM” in the third column specifies the radio band, and “1” in the
fifth column specifies the channel number.
Under this row are 18 rows setting up the analysis intervals (that is, the measurement time windows)
within the first acquisition. For each of these, the first 18 parameters are left blank, because these define
the acquisition, and remain unchanged until the next acquisition begins. Only the last five parameters in
the row define the analysis intervals. For example, the 2nd parameter sets the start time for the interval
(as an offset from the start of the acquisition), and the 3rd parameter sets the length of the interval (in this
example, it is consistently 0.533 ms). The 4th parameter is a bit map value which defines the selection of
measurements to be made (see “4: Measurement Bitmap” on page 32). The 5th parameter specifies an
expected DUT output power level for each interval (this value is used to establish pass/fail criteria for
Basic Transmit Power tests, and to ensure that the Instrument Gain setting is not set too high for the test
input to safely receive the DUT signal).
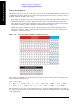
Following the 15 rows defining the analysis intervals for the first acquisition, a new row sets up the
parameters for the second acquisition, and is followed by more rows defining the analysis intervals for
that acquisition.
The parameters for the analyzer list sequencer are described in more detail in Chapter 2 .
In this simple example, the analysis intervals are spaced evenly across the acquisition, and each analysis
interval includes the same measurements. The following example shows how analysis intervals can
overlap as necessary to capture specific sections of data for different measurements.