
User`s guide


104 Agilent E6474A User’s Guide
4 Use Your System
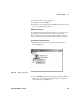
5 After you configure all of the devices, click File > Save. The
options you have selected are saved in the .spf file that is
currently open.
6 Close, then restart the E6474A software. The .spf file that
was open for the last session reopens, with the options saved.
Configuring the Display
Standard Views
Many standard views (windows) are available for each device.
The views display the data you collect during a test. (A data file
from a test can also be played back and displayed.).
Examples of the phone views include Phone Status, which
displays signal parameters, and Layer 3 messages. Examples of
scanner views include the Scanner Chart, which shows signal
strength as text, and Scanner, which shows signal strength as a
graph for all of the channels selected.
Open each view by selecting it from the View menu, keeping in
mind the amount of screen space available. Views can also be
open and minimized to save space. For information on the view,
select it, then press the F1 key.
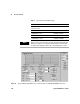
Receiver Views
Views of receiver measurements are displayed in the View Menu
and on the title bars of the views with the measurement name
preceded by the device identifier. For example, the Base Station
Spectrum Analyzer measurement is displayed in a view as the
E64xx_measurement ID_Base Stattion Spectrum Analyzer, as
shown in Figure 44 on page 105. The device identifier helps to
instantly identify it as a receiver view.