
User`s guide

User’s Guide 17
E4438C Option H13 Signal Studio for WiMAX
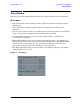
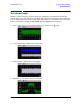
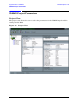
Waveform Graph
Waveform Graph
Click the “Power” button to select from the list of different waveform plots. Selections
include Power, I+Q, I|Q and Spectrum. Each click selects the next plot type in the list. You
can also click the arrow to access a drop-down menu where you can make a direct selection.
If the total number of points exceeds 64000, the first 64000 points are shown.
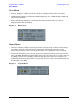
1.
“Power” is the power value plot with each data point formula being
2. “I | Q” displays the I and Q curves separately.
3. “I+Q” plots the I and Q curves overlapped.
4. “Spectrum” is a frequency domain based plot.
I
2
Q
2
+ ⋅