
User`s guide

16 User’s Guide
Signal Studio for WiMAX E4438C Option H13
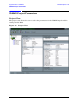
Main Window
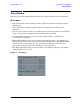
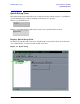
Parameter View
Parameter View shows the parameters for defining the signal. The display changes based on
what parameter has been chosen in the Tree View, described in “WiMAX Project Parameters”
on page 22.
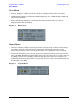
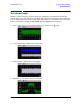
Figure 9 CCDF and Waveform Graph View
The graph view is divided into two areas: the CCDF plot on the left side and the waveform
plot on the right side. A waveform can only be plotted after it has been generated. Each view
can handle multiple waveform data so that if the project contains multiple waveforms, user
can select the desired waveform by clicking the WFMO button. This button will show the
current waveform name.
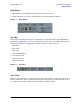
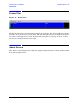
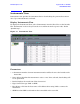
Figure 10 CCDF Graph View
The complementary cumulative distribution function (CCDF) plot displays the probability (in
percentage) of the generated waveform’s calculated peak-to-average power ratio (measured in
dB) meeting or exceeding a certain level. The table to the left of the CCDF plot displays the
calculated peak-to-average values for the current waveform, which is the yellow curve.
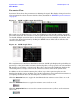
In addition to the waveform’s current plot (yellow), up to three previous plots are also
displayed in shades of gray, enabling you to make comparisons of waveform characteristics as
you adjust parameters. You can also designate a reference curve (red).
Click the Gaussian button to toggle the band-limited noise reference curve (blue) on or off.
Click the Reference button to toggle the reference curve (red) on or off.
Click the Acquire Ref button to store the current waveform curve (yellow) as the reference
curve (red).