
User`s guide


Contents ▲ 470 ▼ Index
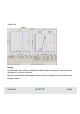
Dot Plot View
Dot plots are graphical representations of the measurement results, where the blue
fluorescence intensity is mapped to the X axis and the red fluorescence intensity is
mapped to the Y axis. Both axes are logarithmic.
In the Grid View, an overview of all samples is shown. The small dot plots are labeled
with the sample name, and below them, the total number of events and the %-value of
the covered events can be read. You can select a single dot plot by clicking on it or you
can move the focus using the Tab key.
Double-clicking a dot plot in the Grid View takes you to the Single View, displaying a
larger view of the dot plots and a result table below the dot plot. To evaluate dot plots,
you can define rectangular regions that can be changed in size and position until they
match the event selection. These regions provide you with the number of cells included
in the region related to the total number of cells. You can move, enlarge, or reduce the
regions. When you change a region, all changes are transferred to the other samples, if
the region is a reference. If the region is not defined as reference, the changes are
restricted to the current sample (refer to “How to Insert a Region in All Dot Plots” on
page 226 for details on reference regions).
Result Table
The result table shows a number of calculated values (columns) for each sample. If you
add or redefine regions, the data in the result tables is recalculated.