
User`s guide


Contents ▲ 459 ▼ Index
Results, Peak Table, and Fragment Table sub-tabs
The sub-tabs Results, Peak Table, and Fragment Table work exactly in the same way as
they do in the gel view. For details on these sub-tabs, please refer to “Gel Tab” on
page 438.
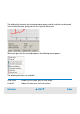
Errors sub-tab
Displays Code, Description and Category of any errors that occured during measurement
or analysis.
Most errors are the result of peaks not being located by the analysis algorithms of the
software. This can be due to a sample or ladder peak not appearing as expected; the data
analysis setpoints (see setpoint explorer below) can also cause peaks to remain
undetected, which can cause errors. Additionally, manually excluding a peak from
analysis or changing the start or end times for a run can cause errors with the peak find
algorithm.
Setpoint Explorer
To analyze your results, you can use the setpoint explorer for modifying data analysis
setpoints for the current sample (Local tab) or for all samples (Global tab). Please refer to
“Gel Tab” on page 438 for information on its usage.