
User`s guide


Contents ▲ 271 ▼ Index
Putting Graphs and Tables on the Clipboard
You can put the following items on the clipboard:
• Gel-like image
• Electropherogram
• Electropherogram overview
• Histogram
• Dot plot
• Standard curve
• Calibration curve
• Raw signals (during chip run)
Copying a graph causes a device-independent bitmap to be placed on the clipboard.
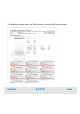
You can put the following tables (or parts of the tables) on the clipboard:
• Result tables
• Peak tables
• Fragment tables
• Ladder tables
• Log book tables
Copying tables causes ASCII data to be placed on the clipboard.