
User`s guide


Contents ▲ 236 ▼ Index
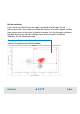
Histogram evaluation
The two histograms displaying the results of the assay are related to calcein (blue
fluorescence) and annexin V (red fluorescence). High fluorescence values in the blue
histogram indicate living cells, low values correspond to dead cells. See the following
image as an example.
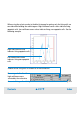
The values are displayed in the result table, each histogram has its own table:
Low fluorescence value
indicates dead cells
High fluorescence value
indicates living cells
All measured events
All events in relation to the
blue marker (here calcein)
Living cells in relation to all measured cells (high calcein fluorescence)