Contents ▲ 234 ▼ Index
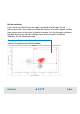
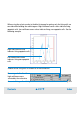
The results of the dot plot evaluation are numerically displayed in the result table:
All measured events
Events covered by the region
Amount of living cells in relation to all measured cells
Amount of living cells with high antibody binding in relation to all living cells