Contents ▲ 102 ▼ Index
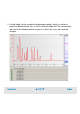
5. A standard curve of migration time versus size is plotted from the sizing ladder by
interpolation between the individual protein size/migration points. The standard curve
derived from the data of the ladder well should resemble the one shown below.