
Technical data


Agilent 41000 Administration Guide, Edition 3 5- 17
Measurement Techniques
Low Resistance Measurements
To Select the Output Current Value
The current source output value is a key factor to perform resistance measurement
accurately. The optimum value can be find as shown below.
Summary • Performs the voltage/current measurement for a sample with current output log sweep
• Plots the resistance, measured voltage, measured current vs. output current curves
• Plots the resistance vs. measured voltage plot curve
• Plots the resistance vs. measured current plot curve
• Decides the current output value for the spot resistance measurement
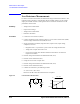
Procedure 1. Connect a sample of the device under test (DUT). And perform current output log
sweep (e.g. Iforce=1 µA to 100 mA). Then measure voltage (Vmeas) and current
(Imeas).
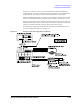
2. Calculate resistance (Rcalc). And plot the Vmeas, Imeas, Rcalc vs. Iforce
characteristics on the log-log graph as shown in
Figure 5-10.
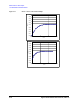
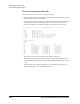
3. Plot the Rcalc vs. Imeas, Vmeas characteristics on the linear-log graph as shown in
Figure 5-11.
4. Decide the current source output value for the resistance spot measurement.
For example of Figure 5-11, the resistance value is stable in the range over 2 mA. The
variation is about 1 % of the resistance value (about 35.55 mΩ). So, an output current
value should be selected from this range. And the other one should be about 1/10 of the
selected current, or less.
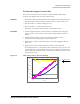
Figure 5-10 Vmeas, Imeas, Rcalc vs. Iforce Plot Example
1.E-06
1.E-05
1.E-04
1.E-03
1.E-02
1.E-01
1.E-06 1.E-05 1.E-04 1.E-03 1.E-02
Iforce
Vmeas or Imeas or Rcalc
Vmeas
Imeas
Rcalc
Rcalc =
Vm Vm(at If=1 µA)
Im Im(at If=1 µA)