
Technical data

Module 3
Data Display and Management
3-16
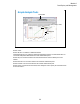
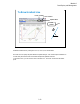
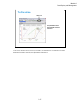
To Draw Regression Line
line
2 cursors
measured data
Cursor To Marker
Line N > Regression
Enable the Regression line by clicking the Line 1 (or Line 2) icon and Regression.
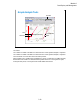
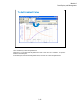
Move cursors to specify the region of the measurement data used for the regression calculation.
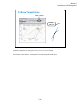
To move the cursor, you can use the Cursor To Marker icon. The cursor will move to the marker
point.