
Technical data

Module 3
Data Display and Management
3-3
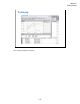
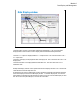
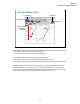
Data Display window
X-Y Graph PLot
Parameters
List Display
The Data Display window is opened after measurement automatically, or by clicking the Data
Display button. And the window is used to display measurement data and analyze the data.
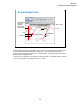
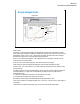
The Show X-Y Graph icon displays/hides the X-Y Graph Plot area. This is the same as the View >
X-Y Graph menu.
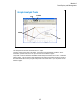
The Show List Display icon displays/hides the List Display area. This is the same as the View > List
Display menu.
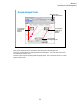
The Show Parameters icon displays/hides the Parameters area. This is the same as the View >
Parameters menu.
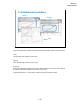
Multiple data display windows can be opened while the Multi Display indicator is ON. Then the test
result data of the same test setup name will
be displayed on the exclusive Data Display window and the test result data of the different test setup
name will be displayed on the new Data Display window. To set Multi Display ON, click the Run
Option button located at the top right of the Main window, check the “Allocate Data Display for each
test” box on the Run Option dialog box, and click the Close button.