
Troubleshooting guide

Lab Exercise: Qualitative Data Analysis
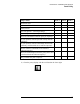
Isoabsorbance Plot
40
Isoabsorbance Plot
In this section, you will try to optimize the data acquisition sample signal with the
emphasis on obtaining the best signal to noise ratio for one chromatographic peak.
Note that to use the Isoabsorbance plot, data must have been acquired with the
spectra stored in the All format
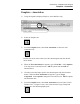
1) Reload Signal B of DEMODAD.D. Use the Select Spectrum at Peak Apex
tool to display the spectrum of the peak at 4.85 minutes.
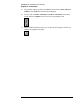
2) Before you make the Isoabsorbance plot, examine the spectrum of the peak of
interest. Convert the cursor to Trace Mode by pointing the cursor at the
spectrum and clicking the right mouse button. The cursor is converted to a
downward pointing arrow that follows the spectrum trace as you move the
mouse. If you find the cursor hard to control, you can also use the right and
left arrow keys on the keyboard to move the cursor. Notice that the cursor
position is identified on the information line at the bottom of the window.
This makes it easy to see where the absorbance maximum occurs.
3) Move the cursor along the spectrum and determine the wavelength to use for
the sample signal. Make a note of it below. Decide what the sample signal
bandwidth should be. Also, select an appropriate reference and reference
bandwidth. Remember the selection guidelines discussed in the lecture.
Sample Signal__________
Sample Signal Bandwidth__________
Reference Signal__________
Reference Bandwidth__________
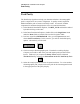
4) Now we are ready to make the Isoabsorbance plot. Under the Spectra menu,
select Iso/3D Plot Options…. Set a time range of 4 to 14 minutes and the
Traditional color scheme. Select Make Isoplot.
5) Once the isoplot has been drawn, take a minute to familiarize yourself with
the display. Check that the Cursor mode is Quick View. Point the cursor at
the vertical cursor and move it right and left to select various spectra. The
spectra at the position of the cursor are shown in the window at the top right.
The blue spectrum that appears in this window is the spectrum you previously