
Troubleshooting guide


Lab Exercise: Advanced Reporting
Performance Reports (System Suitability)
127
Performance Reports (System Suitability)
Many chromatographers utilize the Performance report styles to help evaluate
the analysis system before and during routine analyses. The information
generated for each calibrated peak includes the retention time, k', symmetry, peak
width, plate number, resolution, signal-to-noise ratio, and compound name. You
may also determine the noise and drift using a Performance + Noise report style.
The results can be compared to expected results automatically.
Note: To evaluate the performance of both the analytical instrument or of an
analytical method before routine use, utilize the Sequence Summary function.
Some of the system suitability calculations require the void time or volume. You
may also desire column identification within reports. This information must be
input prior to sample injection and cannot be input after the fact. The first part of
this exercise will demonstrate this process.
1) Go to the Method and Run Control view.
2) Load Quant.M from you previous exercises.
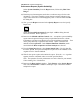
3) Pull down the Instrument menu and select Columns.
4) Fill in the column description, length, diameter, and particle size. Examine
previous runs to determine the void time of the column. If you don't know
how to find the void time, ask your instructor. Scroll to the right and fill in
the value. Select min as the Unit.
5) The Installed field specifies which LC columns are being used. Highlight
this field and select YES for the column in your system.
6) OK this window. Resave your method.
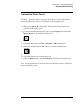
7) Return to the Data Analysis menu. Under Report, select System Suitability,
then Edit Performance Limits....
8) Fill in low and high limits for chosen criteria in absolute units, for instance,
retention times in minutes. The ChemStation will calculate parameters for all
the calibrated peaks in your method. If actual values of any one peak exceed
the defined limits, this will be noted in the report. You can get an idea of the
upper and lower limits for some of the criteria from your Sequence Summary
report from the previous laboratory exercise. Fill in this screen now.
9) Noise can be calculated three different ways. First, as six times the standard
deviation of the linear regression of the drift; second, as peak-to-peak(drift
corrected); and third, as determined by the ASTM method(ASTM E 685-93).