
User's Manual
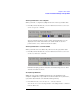
Table Of Contents
- Agilent Technologies 16750A/B Logic Analyzer
- Agilent Technologies 16750A/B Logic Analyzer
- Contents
- Getting Started
- Step 1. Connect the logic analyzer to the device under test
- Step 2. Choose the sampling mode
- Step 3. Format labels for the probed signals
- Step 4. Define the trigger condition
- Step 5. Run the measurement
- Step 6. Display the captured data
- For More Information...
- Example: Timing measurement on counter board
- Example: State measurement on counter board
- Task Guide
- Probing the Device Under Test
- Choosing the Sampling Mode
- To select transitional timing or store qualified
- Formatting Labels for Logic Analyzer Probes
- Setting Up Triggers and Running Measurements
- Displaying Captured Data
- Using Symbols
- Printing/Exporting Captured Data
- Cross-Triggering
- Solving Logic Analysis Problems
- Saving and Loading Logic Analyzer Configurations
- Reference
- The Sampling Tab
- The Format Tab
- Importing Netlist and ASCII Files
- The Trigger Tab
- The Symbols Tab
- Error Messages
- Must assign Pod 1 on the master card to specify actions for flags
- Branch expression is too complex
- Cannot specify range on label with clock bits that span pod pairs
- Counter value checked as an event, but no increment action specified
- Goto action specifies an undefined level
- Maximum of 32 Channels Per Label
- Hardware Initialization Failed
- Must assign another pod pair to specify actions for flags
- No more Edge/Glitch resources available for this pod pair
- No more Pattern resources available for this pod pair
- No Trigger action found in the trace specification
- Slow or Missing Clock
- Timer value checked as an event, but no start action specified
- Trigger function initialization failure
- Trigger inhibited during timing prestore
- Trigger Specification is too complex
- Waiting for Trigger
- Analyzer armed from another module contains no "Arm in from IMB" event
- Specifications and Characteristics
- Concepts
- Understanding Logic Analyzer Triggering
- Understanding State Mode Sampling Positions
- Getting Started
- Glossary
- Index

48
Chapter 2: Task Guide
To select transitional timing or store qualified
The Use demo data (no probes required) option is for demonstration
purposes only.
8. Choose the labels that you wish to run eye finder on.
You may want to run eye finder on channel subsets, for example, when
certain bus signals transition in one operating mode (of the device under
test) and other bus signals transition in a different operating mode.
9. Select the Run Eye Finder button.
For more information on run messages, see “Eye Finder Run Messages” on
page 136.
When eye finder finds more than one stable region on a channel, it uses
the current sampling position as a hint about which stable region it should
suggest a position for.
If eye finder picks the wrong stable region, you can expand the label and
drag the blue Sampling Position line into the correct stable region. The
suggested sampling position for that region will be shown (see “How
Selected/Suggested Positions Behave” on page 135).
10. If you have moved the sampling position and wish to return to the
suggested positions, go to the Eye Finder Results tab, select a label button
or the Results menu, and choose the "set to suggested" command.
For more information on informational messages in the Eye Finder Results
tab, see “Eye Finder Info Messages” on page 139.
Eye finder finds optimal sampling positions for the actual specific
conditions -- amplitude, offset, slew rates, and ambient temperature.
Therefore, you will get the best results by running eye finder under
the same conditions that will be present when logic analysis
measurements are made.
To run eye finder repetitively
1. Select the Repetitive Run option in the Eye Finder Setup tab.
2. Select the Run Eye Finder (r) button.
In the Eye Finder Results tab, you can see how the stable and transitioning
areas vary over time.
3. Select the Stop Eye Finder button.