
User's Manual
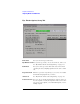
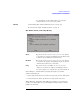
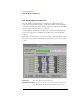
Table Of Contents
- Agilent Technologies 16750A/B Logic Analyzer
- Agilent Technologies 16750A/B Logic Analyzer
- Contents
- Getting Started
- Step 1. Connect the logic analyzer to the device under test
- Step 2. Choose the sampling mode
- Step 3. Format labels for the probed signals
- Step 4. Define the trigger condition
- Step 5. Run the measurement
- Step 6. Display the captured data
- For More Information...
- Example: Timing measurement on counter board
- Example: State measurement on counter board
- Task Guide
- Probing the Device Under Test
- Choosing the Sampling Mode
- To select transitional timing or store qualified
- Formatting Labels for Logic Analyzer Probes
- Setting Up Triggers and Running Measurements
- Displaying Captured Data
- Using Symbols
- Printing/Exporting Captured Data
- Cross-Triggering
- Solving Logic Analysis Problems
- Saving and Loading Logic Analyzer Configurations
- Reference
- The Sampling Tab
- The Format Tab
- Importing Netlist and ASCII Files
- The Trigger Tab
- The Symbols Tab
- Error Messages
- Must assign Pod 1 on the master card to specify actions for flags
- Branch expression is too complex
- Cannot specify range on label with clock bits that span pod pairs
- Counter value checked as an event, but no increment action specified
- Goto action specifies an undefined level
- Maximum of 32 Channels Per Label
- Hardware Initialization Failed
- Must assign another pod pair to specify actions for flags
- No more Edge/Glitch resources available for this pod pair
- No more Pattern resources available for this pod pair
- No Trigger action found in the trace specification
- Slow or Missing Clock
- Timer value checked as an event, but no start action specified
- Trigger function initialization failure
- Trigger inhibited during timing prestore
- Trigger Specification is too complex
- Waiting for Trigger
- Analyzer armed from another module contains no "Arm in from IMB" event
- Specifications and Characteristics
- Concepts
- Understanding Logic Analyzer Triggering
- Understanding State Mode Sampling Positions
- Getting Started
- Glossary
- Index
135
Chapter 3: Reference
Importing Netlist and ASCII Files
Results menu Let you expand/collapse the signals in a label, set the bus
view, set the sampling positions to the suggested sampling
positions, and remove all eye finder data.
Label buttons Let you expand/collapse the signals in a label, set the bus
view, choose the suggested sampling position, and show
message or time stamp information.
Display Area Shows:
• Transitioning (dark) and stable (light) regions on the signals.
• Suggested sampling positions (green triangles).
• The current sampling positions (blue lines).
• Informational message icons . You can move the mouse pointer over the
icon to cause the message to pop up.
• Time stamp icons . You can move the mouse pointer over the icon to
see when the last eye finder measurement was run.
To give you more information about the signals, the display
covers +/-5 ns even though the sampling position may only
be set to +/-3.25 ns.
Sampling
Position Lets you adjust the sampling position. You can also drag the
sampling position bar to a new location.
See Also “Understanding State Mode Sampling Positions” on page 208
“How Selected/Suggested Positions Behave” on page 135
“Eye Finder Run Messages” on page 136
“Eye Finder Info Messages” on page 139
“Eye Finder Load/Save Messages” on page 141
“Eye Finder Option, Setup Tab” on page 132
“To manually adjust sampling positions” on page 50
How Selected/Suggested Positions Behave. The eye finder's
selected and suggested sampling positions behave as follows: