
User's Manual
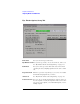
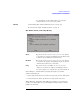
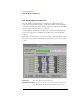
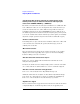
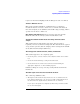
Table Of Contents
- Agilent Technologies 16750A/B Logic Analyzer
- Agilent Technologies 16750A/B Logic Analyzer
- Contents
- Getting Started
- Step 1. Connect the logic analyzer to the device under test
- Step 2. Choose the sampling mode
- Step 3. Format labels for the probed signals
- Step 4. Define the trigger condition
- Step 5. Run the measurement
- Step 6. Display the captured data
- For More Information...
- Example: Timing measurement on counter board
- Example: State measurement on counter board
- Task Guide
- Probing the Device Under Test
- Choosing the Sampling Mode
- To select transitional timing or store qualified
- Formatting Labels for Logic Analyzer Probes
- Setting Up Triggers and Running Measurements
- Displaying Captured Data
- Using Symbols
- Printing/Exporting Captured Data
- Cross-Triggering
- Solving Logic Analysis Problems
- Saving and Loading Logic Analyzer Configurations
- Reference
- The Sampling Tab
- The Format Tab
- Importing Netlist and ASCII Files
- The Trigger Tab
- The Symbols Tab
- Error Messages
- Must assign Pod 1 on the master card to specify actions for flags
- Branch expression is too complex
- Cannot specify range on label with clock bits that span pod pairs
- Counter value checked as an event, but no increment action specified
- Goto action specifies an undefined level
- Maximum of 32 Channels Per Label
- Hardware Initialization Failed
- Must assign another pod pair to specify actions for flags
- No more Edge/Glitch resources available for this pod pair
- No more Pattern resources available for this pod pair
- No Trigger action found in the trace specification
- Slow or Missing Clock
- Timer value checked as an event, but no start action specified
- Trigger function initialization failure
- Trigger inhibited during timing prestore
- Trigger Specification is too complex
- Waiting for Trigger
- Analyzer armed from another module contains no "Arm in from IMB" event
- Specifications and Characteristics
- Concepts
- Understanding Logic Analyzer Triggering
- Understanding State Mode Sampling Positions
- Getting Started
- Glossary
- Index
134
Chapter 3: Reference
Importing Netlist and ASCII Files
Eye Finder Option, Results Tab
The Eye Finder Results display is a digital "eye" diagram in that it
represents many samples of data captured in relation to the sampling
clock. The transitioning edges measured before and after the sampling
clock result in a picture that is eye-shaped.
You should have already specified the logic analyzer threshold voltage,
but you may adjust it to maximize the width of the measured stable
regions.
Eye finder measures the location of the stable region boundaries and
places the logic analyzer's sampling position in the center of the stable
region.
File menu Lets you save/load eye finder data.
EyeFinder menu Lets you run eye finder, choose the run mode, and access
the “Eye Finder Advanced Settings Dialog” on page 133.