
User's Manual


147
Chapter 4: Using the Logic Analyzer in Eye Scan Mode
Displaying Captured Eye Scan Data
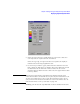
•Turn on the Histogram tool. This tool displays a histogram of the
relative number of transitions at a particular voltage between two
times. The histogram tool is a horizontal line in the display with two
endpoints that can be repositioned. There is a slider bar on the line that
can be positioned for exact measurements at a particular time. The
histogram can be displayed using a linear or logarithmic scale. Note
that the logarithmic scale is disabled when the display is in Channel
Density mode (Ch Density Gray or Ch Density Color.)